
Page 90 - AJWEP-v22i2
P. 90
Ghosh and Prakasam
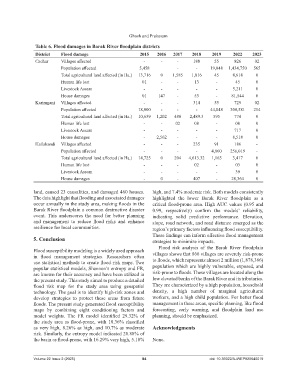
Table 6. Flood damages in Barak River floodplain districts
District Flood damage 2015 2016 2017 2018 2019 2022 2023
Cachar Villages affected - - - 188 55 826 02
Population affected 5,458 - - 19,048 1,434,750 565
Total agricultural land affected (in Ha.) 13,716 0 1,585 1,016 45 8,618 0
Human life lost 01 - - 13 - 45 0
Livestock Assam - - - - - 5,211 0
House damages 01 147 - 53 - 81,544 0
Karimganj Villages affected - - - 314 55 729 02
Population affected 18,800 - - - 44,048 308,581 214
Total agricultural land affected (in Ha.) 10,639 1,202 480 2,489.3 595 774 0
Human life lost - - 02 08 - 08 0
Livestock Assam - - - - - 717 0
House damages - 2,562 - - - 8,518 0
Hailakandi Villages affected - - - 235 91 186 -
Population affected - - - - 4,860 256,019 -
Total agricultural land affected (in Ha.) 14,725 0 204 4,613.32 1,165 3,417 0
Human life lost - - - 02 - 03 0
Livestock Assam - - - - - 39 0
House damages - 0 - 407 - 28,364 0
land, caused 23 causalities, and damaged 460 houses. high, and 7.4% moderate risk. Both models consistently
The data highlight that flooding and associated damages highlighted the lower Barak River floodplain as a
occur annually in the study area, making floods in the critical flood-prone area. High AUC values (0.95 and
Barak River floodplain a common destructive disaster 0.99, respectively) confirm the models’ reliability,
event. This underscores the need for better planning indicating solid predictive performance. Elevation,
and management to reduce flood risks and enhance slope, road network, and road distance emerged as the
resilience for local communities. region’s primary factors influencing flood susceptibility.
These findings can inform effective flood management
5. Conclusion strategies to minimize impacts.
Flood risk analysis of the Barak River floodplain
Flood susceptibility modeling is a widely used approach
in flood management strategies. Researchers often villages shows that 866 villages are severely risk-prone
use statistical methods to create flood risk maps. Two to floods, which represents almost 2 million (1,878,366)
popular statistical models, Shannon’s entropy and FR, population which are highly vulnerable, exposed, and
are known for their accuracy and have been utilized in risk-prone to floods. These villages are located along the
the present study. This study aimed to produce a detailed low elevated banks of the Barak River and its tributaries.
flood risk map for the study area using geospatial They are characterized by a high population, household
technology. The goal is to identify high-risk zones and density, a high number of marginal agricultural
develop strategies to protect these areas from future workers, and a high child population. For better flood
floods. The present study generated flood susceptibility management in these areas, specific planning, like flood
maps by combining eight conditioning factors and forecasting, early warning, and floodplain land use
model weights. The FR model identified 29.32% of planning, should be emphasized.
the study area as flood-prone, with 10.36% classified
as very high, 8.26% as high, and 10.7% as moderate Acknowledgments
risk. Similarly, the entropy model indicated 28.88% of
the basin as flood-prone, with 16.29% very high, 5.18% None.
Volume 22 Issue 2 (2025) 84 doi: 10.36922/AJWEP025040019