
Page 96 - AJWEP-v22i2
P. 96
Sao, et al.
(LCR) and non-carcinogenic health risks associated Table 1. Summary of exposure assumptions used
with heavy metal exposure. for health risk assessment
The non-carcinogenic risk was determined using Risk exposure Unit Values
Equations I–II: 17 factors Men Women Children
CIREFED�� �� �� Ingestion rate L/day 2 2 1
ADD (I)
BW AT�� Exposure Days/ 365 365 365
frequency year
ADD Exposure Years 20 20 20
HQ = (II)
RfD duration
Average Day 7.300 7.300 7.300
Where HQ is the hazard quotient (HQ < 1 suggests time (AT) for
unlikely adverse health effects, while HQ > 1 indicates non-carcinogenic
a higher probability of adverse health effects ), AT for Day 25,550 25,550 25,550
18
ADD is the average daily dose (mg/kg/day), C is the carcinogenic
average concentration of heavy metals in water, IR Average body Kg 70 60 20
is the ingestion rate of drinking water per capita, EF weight
is exposure frequency, ED is exposure duration, BW
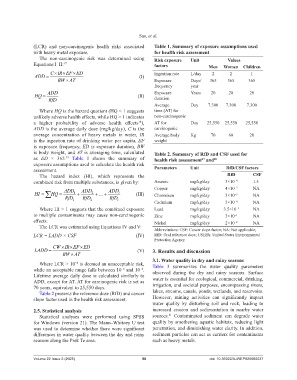
is body weight, and AT is averaging time, calculated Table 2. Summary of RfD and CSF used for
as ED × 365. Table 1 shows the summary of health risk assessment and 20
19
17
exposure assumptions used to calculate the health risk
assessment. Parameters Unit RfD/CSF factors
The hazard index (HI), which represents the RfD CSF
combined risk from multiple substances, is given by: Arsenic mg/kg/day 3×10 −4 1.5
−2
HI HQ ADD 1 ADD 2 ADD i (III) Copper mg/kg/day 4×10 −3 NA
NA
Chromium
3×10
mg/kg/day
RfD
Cadmium mg/kg/day 5×10 −4 NA
1 RfD 2 RfD i
Where HI > 1 suggests that the combined exposure Lead mg/kg/day 3.5×10 −3 NA
to multiple contaminants may cause non-carcinogenic Zinc mg/kg/day 3×10 −1 NA
effects. Nickel mg/kg/day 2×10 −2 NA
The LCR was estimated using Equations IV and V:
Abbreviations: CSF: Cancer slope factor; NA: Not applicable;
LCR = LADD × CSF (IV) RfD: Oral reference dose; USEPA: United States Environmental
Protection Agency.
CW IR EF ED�� �� ��
LADD (V) 3. Results and discussion
BW AT��
3.1. Water quality in dry and rainy seasons
Where LCR > 10 is deemed an unacceptable risk, Table 3 summarizes the water quality parameters
−4
while an acceptable range falls between 10 and 10 . observed during the dry and rainy seasons. Surface
−4
−6
Lifetime average daily dose is calculated similarly to
ADD, except for AT. AT for carcinogenic risk is set as water is essential for ecological, commercial, drinking,
70 years, equivalent to 25,550 days. irrigation, and societal purposes, encompassing rivers,
Table 2 presents the reference dose (RfD) and cancer lakes, streams, canals, ponds, wetlands, and reservoirs.
slope factor used in the health risk assessment. However, mining activities can significantly impact
water quality by disturbing soil and rock, leading to
2.5. Statistical analysis increased erosion and sedimentation in nearby water
21
Statistical analyses were performed using SPSS sources. Contaminated sediment can degrade water
for Windows (version 21). The Mann–Whitney U test quality by smothering aquatic habitats, reducing light
was used to determine whether there were significant penetration, and diminishing water clarity. In addition,
differences in water quality between the dry and rainy sediment particles can act as carriers for contaminants
seasons along the Prek Te area. such as heavy metals.
Volume 22 Issue 2 (2025) 90 doi: 10.36922/AJWEP025060037