
Page 97 - AJWEP-v22i2
P. 97
Water quality impact from mining in Prek Te
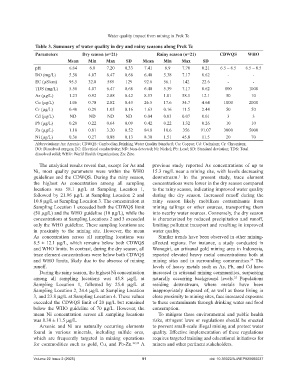
Table 3. Summary of water quality in dry and rainy seasons along Prek Te
Parameters Dry season (n=21) Rainy season (n=21) CDWQS WHO
Mean Min Max SD Mean Min Max SD
pH 6.64 6.0 7.20 0.33 7.41 6.9 7.70 0.21 6.5 – 8.5 6.5 – 8.5
DO (mg/L) 5.58 4.07 6.47 0.68 6.40 5.38 7.17 0.62 - -
EC (µS/cm) 95.5 32.8 589 129 92.6 56.1 142 22.6 - -
TDS (mg/L) 5.58 4.07 6.47 0.68 6.40 5.39 7.17 0.62 800 1000
As (µg/L) 1.23 0.92 2.88 0.42 8.53 1.01 58.1 12.1 50 10
Cu (µg/L) 1.06 0.78 2.82 0.43 26.5 17.6 34.7 4.64 1000 2000
Cr (µg/L) 0.40 0.29 1.05 0.16 1.63 0.16 11.5 2.44 50 50
Cd (µg/L) ND ND ND ND 0.04 0.03 0.07 0.01 3 3
Pb (µg/L) 0.28 0.22 0.64 0.09 0.42 0.22 1.32 0.26 10 10
Zn (µg/L) 1.18 0.81 3.20 0.52 84.8 10.6 356 91.07 3000 5000
Ni (µg/L) 0.36 0.27 0.88 0.13 8.30 1.51 45.8 11.5 20 70
Abbreviations: As: Arsenic; CDWQS: Cambodian Drinking Water Quality Standard; Cu: Copper; Cd: Cadmium; Cr: Chromium;
DO: Dissolved oxygen; EC: Electrical conductivity; ND: Non-detected; Ni: Nickel; Pb: Lead; SD: Standard deviation; TDS: Total
dissolved solid; WHO: World Health Organization; Zn: Zinc.
The analytical results reveal that, except for As and previous study reported As concentrations of up to
Ni, most quality parameters were within the WHO 15.3 mg/L near a mining site, with levels decreasing
guidelines and the CDWQS. During the rainy season, downstream. In the present study, trace element
1
the highest As concentration among all sampling concentrations were lower in the dry season compared
locations was 58.1 µg/L at Sampling Location 1, to the rainy season, indicating improved water quality
followed by 21.96 µg/L at Sampling Location 2 and during the dry season. Increased runoff during the
10.8 µg/L at Sampling Location 3. The concentration at rainy season likely mobilizes contaminants from
Sampling Location 1 exceeded both the CDWQS limit mining tailings or other sources, transporting them
(50 µg/L) and the WHO guideline (10 µg/L), while the into nearby water sources. Conversely, the dry season
concentrations at Sampling Locations 2 and 3 exceeded is characterized by reduced precipitation and runoff,
only the WHO guideline. These sampling locations are limiting pollutant transport and resulting in improved
in proximity to the mining site. However, the mean water quality.
As concentration across all sampling locations was Similar trends have been observed in other mining-
8.5 ± 12.1 µg/L, which remains below both CDWQS affected regions. For instance, a study conducted in
and WHO limits. In contrast, during the dry season, all Wonogiri, an artisanal gold mining area in Indonesia,
trace element concentrations were below both CDWQS reported elevated heavy metal concentrations both at
and WHO limits, likely due to the absence of mining mining sites and in surrounding communities. The
24
runoff. levels of heavy metals such as As, Pb, and Cd have
During the rainy season, the highest Ni concentration increased in artisanal mining communities, surpassing
among all sampling locations was 45.8 µg/L at naturally occurring background levels. Populations
25
Sampling Location 1, followed by 25.4 µg/L at residing downstream, where metals have been
Sampling Location 2, 24.4 µg/L at Sampling Location inappropriately disposed of, as well as those living in
3, and 23.8 µg/L at Sampling Location 4. These values close proximity to mining sites, face increased exposure
exceeded the CDWQS limit of 20 µg/L but remained to these contaminants through drinking water and food
below the WHO guideline of 70 µg/L. However, the consumption.
mean Ni concentration across all sampling locations To mitigate these environmental and public health
was 8.30 ± 11.5 µg/L. risks, stringent laws or regulations should be enacted
Arsenic and Ni are naturally occurring elements to prevent small-scale illegal mining and protect water
found in various minerals, including sulfide ores, quality. Effective implementation of these regulations
which are frequently targeted in mining operations requires targeted training and educational initiatives for
for commodities such as gold, Cu, and Pb-Zn. 22,23 A miners and other pertinent stakeholders.
Volume 22 Issue 2 (2025) 91 doi: 10.36922/AJWEP025060037