
Page 187 - AJWEP-v22i3
P. 187
Maghnia wastewater and risk assessment
A
B
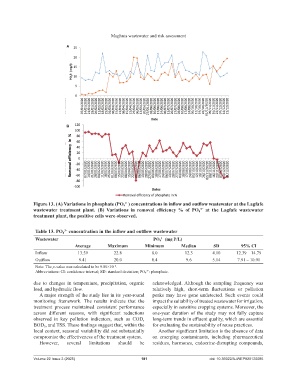
Figure 13. (A) Variations in phosphate (PO 4 ) concentrations in inflow and outflow wastewater at the Lagfafe
3−
wastewater treatment plant. (B) Variations in removal efficiency % of PO 4 at the Lagfafe wastewater
3−
treatment plant, the positive cells were observed.
Table 13. PO 4 concentration in the inflow and outflow wastewater
3−
Wastewater PO 4 (mg P/L)
3−
Average Maximum Minimum Median SD 95% CI
Inflow 13.59 22.8 8.0 12.3 4.10 12.39 – 14.79
Outflow 9.41 20.0 0.4 9.6 5.14 7.91 – 10.91
Note: The p-value was calculated to be 9.80×10 .
−6
3−
Abbreviations: CI: confidence interval; SD: standard deviation; PO 4 : phosphate.
due to changes in temperature, precipitation, organic acknowledged. Although the sampling frequency was
load, and hydraulic flow. relatively high, short-term fluctuations or pollution
A major strength of the study lies in its year-round peaks may have gone undetected. Such events could
monitoring framework. The results indicate that the impact the suitability of treated wastewater for irrigation,
treatment process maintained consistent performance especially in sensitive cropping systems. Moreover, the
across different seasons, with significant reductions one-year duration of the study may not fully capture
observed in key pollution indicators, such as COD, long-term trends in effluent quality, which are essential
BOD 5 , and TSS. These findings suggest that, within the for evaluating the sustainability of reuse practices.
local context, seasonal variability did not substantially Another significant limitation is the absence of data
compromise the effectiveness of the treatment system. on emerging contaminants, including pharmaceutical
However, several limitations should be residues, hormones, endocrine-disrupting compounds,
Volume 22 Issue 3 (2025) 181 doi: 10.36922/AJWEP025120085