
Page 184 - AJWEP-v22i3
P. 184
Mounira
and 0.006 mg N/L for the effluent. The average dynamics. The process also contributes to a slight decrease
NO 2 removal efficiency was 42.44% (Figure 10B). in concentration variability in the treated effluent.
−
However, removal efficiency was occasionally
reduced, likely due to elevated concentrations 3.9. NO 3 ⁻
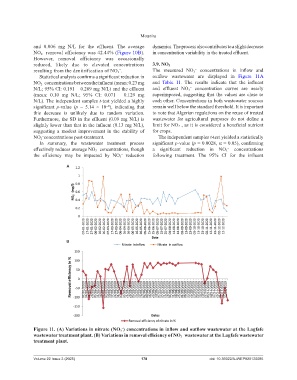
resulting from the denitrification of NO 3 ⁻. The measured NO 3 ⁻ concentrations in inflow and
Statistical analysis confirms a significant reduction in outflow wastewater are displayed in Figure 11A
NO 2 concentrations between the influent (mean: 0.23 mg and Table 11. The results indicate that the influent
−
N/L; 95% CI: 0.191 – 0.269 mg N/L) and the effluent and effluent NO 3 ⁻ concentration curves are nearly
(mean: 0.10 mg N/L; 95% CI: 0.071 – 0.129 mg superimposed, suggesting that the values are close to
N/L). The independent samples t-test yielded a highly each other. Concentrations in both wastewater sources
significant p-value (p = 5.14 × 10⁻ ), indicating that remain well below the standard threshold. It is important
8
this decrease is unlikely due to random variation. to note that Algerian regulations on the reuse of treated
Furthermore, the SD in the effluent (0.09 mg N/L) is wastewater for agricultural purposes do not define a
slightly lower than that in the influent (0.13 mg N/L), limit for NO₃⁻, as it is considered a beneficial nutrient
suggesting a modest improvement in the stability of for crops.
NO 2 concentrations post-treatment. The independent samples t-test yielded a statistically
−
In summary, the wastewater treatment process significant p-value (p = 0.0028, α = 0.05), confirming
effectively reduces average NO 2 concentrations, though a significant reduction in NO 3 ⁻ concentrations
−
the efficiency may be impacted by NO 3 ⁻ reduction following treatment. The 95% CI for the influent
A
B
Figure 11. (A) Variations in nitrate (NO 3 ⁻) concentrations in inflow and outflow wastewater at the Lagfafe
wastewater treatment plant. (B) Variations in removal efficiency of NO 3 ⁻ wastewater at the Lagfafe wastewater
treatment plant.
Volume 22 Issue 3 (2025) 178 doi: 10.36922/AJWEP025120085