
Page 181 - AJWEP-v22i3
P. 181
Maghnia wastewater and risk assessment
The results revealed that the TSS concentration in the 3.6. DO
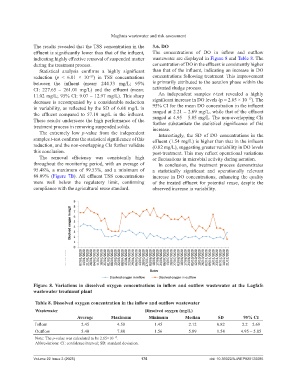
effluent is significantly lower than that of the influent, The concentrations of DO in inflow and outflow
indicating highly effective removal of suspended matter wastewater are displayed in Figure 8 and Table 8. The
during the treatment process. concentration of DO in the effluent is consistently higher
Statistical analysis confirms a highly significant than that of the influent, indicating an increase in DO
reduction (p < 6.01 × 10 ) in TSS concentrations concentrations following treatment. This improvement
−29
between the influent (mean: 244.33 mg/L; 95% is primarily attributed to the aeration phase within the
CI: 227.65 – 261.01 mg/L) and the effluent (mean: activated sludge process.
11.02 mg/L; 95% CI: 9.07 – 12.97 mg/L). This sharp An independent samples t-test revealed a highly
−17
decrease is accompanied by a considerable reduction significant increase in DO levels (p = 2.65 × 10 ). The
in variability, as reflected by the SD of 6.68 mg/L in 95% CI for the mean DO concentration in the influent
the effluent compared to 57.10 mg/L in the influent. ranged at 2.21 – 2.69 mg/L, while that of the effluent
ranged at 4.95 – 5.85 mg/L. The non-overlapping CIs
These results underscore the high performance of the further substantiate the statistical significance of this
treatment process in removing suspended solids. increase.
The extremely low p-value from the independent Interestingly, the SD of DO concentrations in the
samples t-test confirms the statistical significance of this effluent (1.54 mg/L) is higher than that in the influent
reduction, and the non-overlapping CIs further validate (0.82 mg/L), suggesting greater variability in DO levels
this conclusion. post-treatment. This may reflect operational variations
The removal efficiency was consistently high or fluctuations in microbial activity during aeration.
throughout the monitoring period, with an average of In conclusion, the treatment process demonstrates
95.48%, a maximum of 99.53%, and a minimum of a statistically significant and operationally relevant
88.09% (Figure 7B). All effluent TSS concentrations increase in DO concentrations, enhancing the quality
were well below the regulatory limit, confirming of the treated effluent for potential reuse, despite the
compliance with the agricultural reuse standard. observed increase in variability.
Figure 8. Variations in dissolved oxygen concentrations in inflow and outflow wastewater at the Lagfafe
wastewater treatment plant
Table 8. Dissolved oxygen concentration in the inflow and outflow wastewater
Wastewater Dissolved oxygen (mg/L)
Average Maximum Minimum Median SD 95% CI
Inflow 2.45 4.58 1.45 2.12 0.82 2.2 – 2.69
Outflow 5.40 7.80 1.56 5.89 1.54 4.95 – 5.85
Note: The p-value was calculated to be 2.65×10 .
−17
Abbreviations: CI: confidence interval; SD: standard deviation.
Volume 22 Issue 3 (2025) 175 doi: 10.36922/AJWEP025120085