
Page 178 - AJWEP-v22i3
P. 178
Mounira
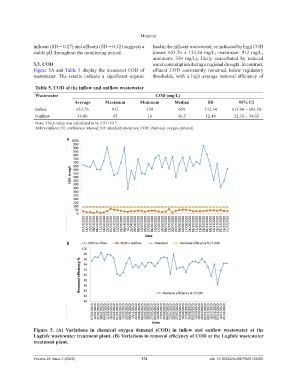
influent (SD = 0.27) and effluent (SD = 0.32) suggests a load in the influent wastewater, as indicated by high COD
stable pH throughout the monitoring period. (mean: 653.76 ± 132.54 mg/L; maximum: 932 mg/L;
minimum: 339 mg/L), likely exacerbated by reduced
3.3. COD water consumption during a regional drought. In contrast,
Figure 5A and Table 5 display the measured COD of effluent COD consistently remained below regulatory
wastewater. The results indicate a significant organic thresholds, with a high average removal efficiency of
Table 5. COD of the inflow and outflow wastewater
Wastewater COD (mg/L)
Average Maximum Minimum Median SD 95% CI
Inflow 653.76 932 339 659 132.54 615.04 – 692.50
Outflow 36.00 65 10 36.5 12.48 32.35 – 39.65
Note: The p-value was calculated to be 3.97×10 .
−47
Abbreviations: CI: confidence interval; SD: standard deviation; COD: chemical oxygen demand.
A
B
Figure 5. (A) Variations in chemical oxygen demand (COD) in inflow and outflow wastewater at the
Lagfafe wastewater treatment plant. (B) Variations in removal efficiency of COD at the Lagfafe wastewater
treatment plant.
Volume 22 Issue 3 (2025) 172 doi: 10.36922/AJWEP025120085