
Page 180 - AJWEP-v22i3
P. 180
Mounira
a maximum of 99.56% observed in December 2020 and influent BOD 5 mean ranged at 372.44 – 425.82 mg/L,
a minimum of 91.87% in November 2020 (Figure 6B). while the effluent BOD 5 mean was 10.03 – 14.23 mg/L.
These results reflect the high performance of the These non-overlapping intervals further support the
activated sludge process in degrading organic matter. conclusion of a substantial and statistically significant
An independent samples t-test yielded a highly reduction in BOD 5 levels due to the treatment process.
significant p-value (p < 1.49 × 10 ), rejecting the null
−26
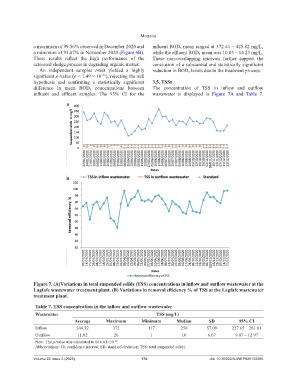
hypothesis and confirming a statistically significant 3.5. TSSs
difference in mean BOD 5 concentrations between The concentration of TSS in inflow and outflow
influent and effluent samples. The 95% CI for the wastewater is displayed in Figure 7A and Table 7.
A
B
Figure 7. (A)Variations in total suspended solids (TSS) concentrations in inflow and outflow wastewater at the
Lagfafe wastewater treatment plant. (B) Variations in removal efficiency % of TSS at the Lagfafe wastewater
treatment plant.
Table 7. TSS concentration in the inflow and outflow wastewater
Wastewater TSS (mg/L)
Average Maximum Minimum Median SD 95% CI
Inflow 244.32 372 117 250 57.09 227.65 – 261.01
Outflow 11.02 26 1 10 6.67 9.07 – 12.97
Note: The p-value was calculated to be 6.01×10 .
−29
Abbreviations: CI: confidence interval; SD: standard deviation; TSS: total suspended solids.
Volume 22 Issue 3 (2025) 174 doi: 10.36922/AJWEP025120085