
Page 182 - AJWEP-v22i3
P. 182
Mounira
yielded an extremely low p-value (p = 2.46 × 10 ),
−31
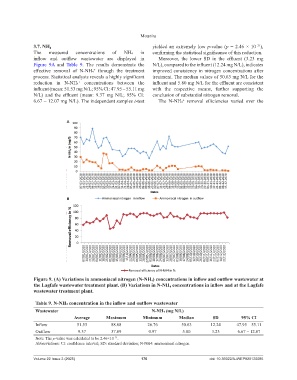
3.7. NH 4
The measured concentrations of NH₄ in confirming the statistical significance of this reduction.
inflow and outflow wastewater are displayed in Moreover, the lower SD in the effluent (3.23 mg
Figure 9A and Table 9. The results demonstrate the N/L), compared to the influent (12.24 mg N/L), indicates
effective removal of N-NH₄⁺ through the treatment improved consistency in nitrogen concentrations after
process. Statistical analysis reveals a highly significant treatment. The median values of 50.63 mg N/L for the
reduction in N-NH₄⁺ concentrations between the influent and 5.80 mg N/L for the effluent are consistent
influent (mean: 51.53 mg N/L; 95% CI: 47.95 – 55.11 mg with the respective means, further supporting the
N/L) and the effluent (mean: 9.37 mg N/L; 95% CI: conclusion of substantial nitrogen removal.
6.67 – 12.07 mg N/L). The independent samples t-test The N-NH₄⁺ removal efficiencies varied over the
A
B
Figure 9. (A) Variations in ammoniacal nitrogen (N-NH 4 ) concentrations in inflow and outflow wastewater at
the Lagfafe wastewater treatment plant. (B) Variations in N-NH 4 concentrations in inflow and at the Lagfafe
wastewater treatment plant.
Table 9. N‑NH₄ concentration in the inflow and outflow wastewater
Wastewater N‑NH₄ (mg N/L)
Average Maximum Minimum Median SD 95% CI
Inflow 51.53 88.68 26.76 50.63 12.24 47.95 – 55.11
Outflow 9.37 37.09 0.97 5.80 3.23 6.67 – 12.07
Note: The p-value was calculated to be 2.46×10 .
−31
Abbreviations: CI: confidence interval; SD: standard deviation; N-NH4: ammoniacal nitrogen.
Volume 22 Issue 3 (2025) 176 doi: 10.36922/AJWEP025120085