
Page 186 - AJWEP-v22i3
P. 186
Mounira
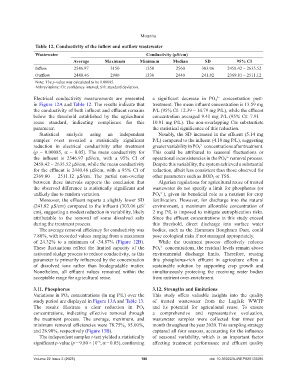
Table 12. Conductivity of the inflow and outflow wastewater
Wastewater Conductivity (µS/cm)
Average Maximum Minimum Median SD 95% CI
Inflow 2546.97 3150 1350 2560 303.06 2458.42 – 2635.52
Outflow 2440.46 2900 1330 2440 241.82 2369.81 – 2511.12
Note: The p-value was calculated to be 0.00085.
Abbreviations: CI: confidence interval; SD: standard deviation.
Electrical conductivity measurements are presented a significant decrease in PO 4 concentration post-
3−
in Figure 12A and Table 12. The results indicate that treatment. The mean influent concentration is 13.59 mg
the conductivity of both influent and effluent remains P/L (95% CI: 12.39 – 14.79 mg P/L), while the effluent
below the threshold established by the agricultural concentration averaged 9.41 mg P/L (95% CI: 7.91 –
reuse standard, indicating compliance for this 10.91 mg P/L). The non-overlapping CIs substantiate
parameter. the statistical significance of this reduction.
Statistical analysis using an independent Notably, the SD increased in the effluent (5.14 mg
samples t-test revealed a statistically significant P/L) compared to the influent (4.10 mg P/L), suggesting
reduction in electrical conductivity after treatment greater variability in PO 4 concentrations after treatment.
3−
(p = 0.00085, α = 0.05). The mean conductivity for This could be attributed to seasonal fluctuations or
the influent is 2546.97 μS/cm, with a 95% CI of operational inconsistencies in the PO 4 removal process.
3−
2458.42 – 2635.52 μS/cm, while the mean conductivity Despite this variability, the system achieved a substantial
for the effluent is 2440.46 μS/cm, with a 95% CI of reduction, albeit less consistent than those observed for
2369.80 – 2511.12 μS/cm. The partial non-overlap other parameters such as BOD 5 or TSS.
between these intervals supports the conclusion that Algerian regulations for agricultural reuse of treated
the observed difference is statistically significant and wastewater do not specify a limit for phosphorus (or
unlikely due to random variation. PO 4 ), given its beneficial role as a nutrient for crop
3−
Moreover, the effluent reports a slightly lower SD fertilization. However, for discharge into the natural
(241.82 μS/cm) compared to the influent (303.06 μS/ environment, a maximum allowable concentration of
cm), suggesting a modest reduction in variability, likely 2 mg P/L is imposed to mitigate eutrophication risks.
attributable to the removal of some dissolved salts Since the effluent concentrations in this study exceed
during the treatment process. this threshold, direct discharge into surface water
The average removal efficiency for conductivity was bodies, such as the Hammam Boughrara Dam, could
7.80%, with recorded values ranging from a maximum pose ecological risks if not managed appropriately.
of 24.32% to a minimum of -34.87% (Figure 12B). While the treatment process effectively reduces
These fluctuations reflect the limited capacity of the PO 4 concentrations, the residual levels remain above
3−
activated sludge process to reduce conductivity, as this environmental discharge limits. Therefore, reusing
parameter is primarily influenced by the concentration this phosphorus-rich effluent in agriculture offers a
of dissolved ions rather than biodegradable matter. sustainable solution by supporting crop growth and
Nonetheless, all effluent values remained within the simultaneously protecting the receiving water bodies
acceptable range for agricultural reuse. from nutrient over-enrichment.
3.11. Phosphorus 3.12. Strengths and limitations
Variations in PO 4 concentrations (in mg P/L) over the This study offers valuable insights into the quality
study period are displayed in Figure 13A and Table 13. of treated wastewater from the Lagfafe WWTP
The results illustrate a clear reduction in PO 4 and its potential for agricultural reuse. To ensure
concentrations, indicating effective removal through a comprehensive and representative evaluation,
the treatment process. The average, maximum, and wastewater samples were collected four times per
minimum removal efficiencies were 78.75%, 95.00%, month throughout the year 2020. This sampling strategy
and 28.90%, respectively (Figure 13B). captured all four seasons, accounting for the influence
The independent samples t-test yielded a statistically of seasonal variability, which is an important factor
significant p-value (p = 9.80 × 10 , α = 0.05), confirming affecting treatment performance and effluent quality
−6
Volume 22 Issue 3 (2025) 180 doi: 10.36922/AJWEP025120085