
Page 183 - AJWEP-v22i3
P. 183
Maghnia wastewater and risk assessment
monitoring period, with an average efficiency of 3.8. NO 2 −
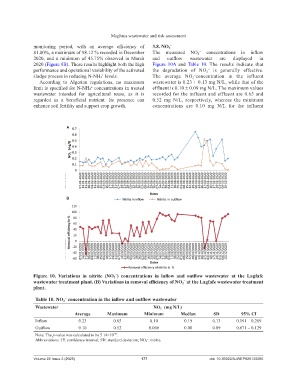
81.80%, a maximum of 98.12 % recorded in December The measured NO 2 concentrations in inflow
−
2020, and a minimum of 45.75% observed in March and outflow wastewater are displayed in
2020 (Figure 9B). These results highlight both the high Figure 10A and Table 10. The results indicate that
performance and operational variability of the activated the degradation of NO 2 is generally effective.
−
sludge process in reducing N-NH₄⁺ levels. The average NO 2 concentration in the influent
−
According to Algerian regulations, no maximum wastewater is 0.23 ± 0.13 mg N/L, while that of the
limit is specified for N-NH₄⁺ concentrations in treated effluent is 0.10 ± 0.09 mg N/L. The maximum values
wastewater intended for agricultural reuse, as it is recorded for the influent and effluent are 0.65 and
regarded as a beneficial nutrient. Its presence can 0.52 mg N/L, respectively, whereas the minimum
enhance soil fertility and support crop growth. concentrations are 0.10 mg N/L for the influent
A
B
Figure 10. Variations in nitrite (NO 2 ) concentrations in inflow and outflow wastewater at the Lagfafe
−
wastewater treatment plant. (B) Variations in removal efficiency of NO 2 at the Lagfafe wastewater treatment
−
plant.
Table 10. NO 2 concentration in the inflow and outflow wastewater
−
Wastewater NO 2 (mg N/L)
−
Average Maximum Minimum Median SD 95% CI
Inflow 0.23 0.65 0.10 0.19 0.13 0.191 – 0.269
Outflow 0.10 0.52 0.006 0.08 0.09 0.071 – 0.129
Note: The p-value was calculated to be 5.14×10⁻⁸.
Abbreviations: CI: confidence interval; SD: standard deviation; NO 2 : nitrite.
−
Volume 22 Issue 3 (2025) 177 doi: 10.36922/AJWEP025120085