
Page 179 - AJWEP-v22i3
P. 179
Maghnia wastewater and risk assessment
94.48% (range: 86.46 – 98.61%) (Figure 5B). This robust of 399.12 ± 91.33 mg/L. The maximum concentration
performance is further supported by a highly significant of 640 mg/L was recorded in October 2020, while the
reduction in COD (p < 3.97 × 10 ) from the influent minimum value of 200 mg/L was observed in November
−47
(95% CI: 615.04 – 692.50 mg/L) to the effluent (95% 2020. The significant separation between the influent
CI: 32.35 – 39.65 mg/L), accompanied by a marked and effluent curves clearly indicates effective BOD 5
decrease in variability. These findings underscore the removal.
remarkable efficacy of the activated sludge process in Throughout the study period, the effluent BOD 5
removing oxidizable organic matter. consistently aligned with the regulatory standard, with
no values exceeding the limit of 30 mg/L. This confirms
3.4. BOD that the treated wastewater complies with the standard
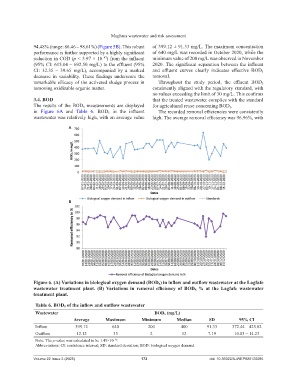
The results of the BOD 5 measurements are displayed for agricultural reuse concerning BOD 5 .
in Figure 6A and Table 6. BOD 5 in the influent The recorded removal efficiencies were consistently
wastewater was relatively high, with an average value high. The average removal efficiency was 96.96%, with
A
B
Figure 6. (A) Variations in biological oxygen demand (BOD 5 ) in inflow and outflow wastewater at the Lagfafe
wastewater treatment plant. (B) Variations in removal efficiency of BOD 5 % at the Lagfafe wastewater
treatment plant.
Table 6. BOD 5 of the inflow and outflow wastewater
Wastewater BOD 5 (mg/L)
Average Maximum Minimum Median SD 95% CI
Inflow 399.12 640 200 400 91.33 372.44 – 425.82
Outflow 12.12 33 2 12 7.19 10.03 – 14.23
Note: The p-value was calculated to be 1.49×10 .
−26
Abbreviations: CI: confidence interval; SD: standard deviation; BOD: biological oxygen demand.
Volume 22 Issue 3 (2025) 173 doi: 10.36922/AJWEP025120085