
Page 177 - AJWEP-v22i3
P. 177
Maghnia wastewater and risk assessment
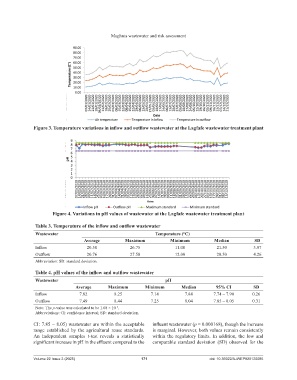
Figure 3. Temperature variations in inflow and outflow wastewater at the Lagfafe wastewater treatment plant
Figure 4. Variations in pH values of wastewater at the Lagfafe wastewater treatment plant
Table 3. Temperature of the inflow and outflow wastewater
Wastewater Temperature (°C)
Average Maximum Minimum Median SD
Inflow 20.50 26.75 11.00 21.50 3.97
Outflow 20.76 27.50 12.00 20.50 4.26
Abbreviation: SD: standard deviation.
Table 4. pH values of the inflow and outflow wastewater
Wastewater pH
Average Maximum Minimum Median 95% CI SD
Inflow 7.82 8.25 7.14 7.88 7.74 – 7.90 0.26
Outflow 7.49 8.44 7.25 8.04 7.85 – 8.05 0.31
Note: The p-value was calculated to be 1.68 × 10 .
−4
Abbreviations: CI: confidence interval; SD: standard deviation.
CI: 7.85 – 8.05) wastewater are within the acceptable influent wastewater (p = 0.000168), though the increase
range established by the agricultural reuse standards. is marginal. However, both values remain consistently
An independent samples t-test reveals a statistically within the regulatory limits. In addition, the low and
significant increase in pH in the effluent compared to the comparable standard deviation (SD) observed for the
Volume 22 Issue 3 (2025) 171 doi: 10.36922/AJWEP025120085