
Page 208 - AJWEP-v22i3
P. 208
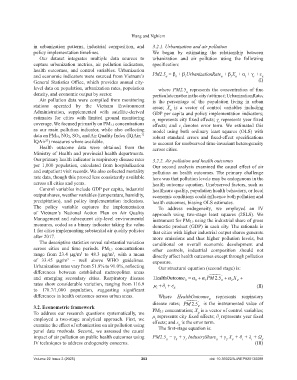
Hung and Nghiem
in urbanization patterns, industrial composition, and 3.2.1. Urbanization and air pollution
policy implementation timelines. We began by estimating the relationship between
Our dataset integrates multiple data sources to urbanization and air pollution using the following
capture urbanization metrics, air pollution indicators, specification:
health outcomes, and control variables. Urbanization
and economic indicators were sourced from Vietnam’s PM2.5 = β + β UrbanizationRate + β X + α + γ + ε it
2
0
it
1
t
i
it
it
General Statistics Office, which provides annual city- (I)
level data on population, urbanization rates, population where PM2.5 represents the concentration of fine
it
density, and economic output by sector. particulate matter in the city i at time t; UrbanizationRateit
Air pollution data were compiled from monitoring is the percentage of the population living in urban
stations operated by the Vietnam Environment areas; X is a vector of control variables including
it
Administration, supplemented with satellite-derived GDP per capita and policy implementation indicators;
estimates for cities with limited ground monitoring α represents city fixed effects; γ represents year fixed
i
t
coverage. We focused primarily on PM2.5 concentrations effects; and ε denotes error term. We estimated this
I
as our main pollution indicator, while also collecting model using both ordinary least squares (OLS) with
data on PM10, NO2, SO2, and Air Quality Index (IQAir; robust standard errors and fixed-effect specifications
32
IQAir ) measures where available. to account for unobserved time-invariant heterogeneity
33
Health outcome data were obtained from the across cities.
Ministry of Health and provincial health departments.
Our primary health indicator is respiratory disease rates 3.2.2. Air pollution and health outcomes
per 1,000 population, calculated from hospitalization Our second analysis examined the causal effect of air
and outpatient visit records. We also collected mortality pollution on health outcomes. The primary challenge
rate data, though this proved less consistently available here was that pollution levels may be endogenous in the
across all cities and years. health outcome equation. Unobserved factors, such as
Control variables include GDP per capita, industrial healthcare quality, population health behaviors, or local
output shares, weather variables (temperature, humidity, economic conditions could influence both pollution and
precipitation), and policy implementation indicators. health outcomes, biasing OLS estimates.
The policy variable captures the implementation To address endogeneity, we employed an IV
of Vietnam’s National Action Plan on Air Quality approach using two-stage least squares (2SLS). We
Management and subsequent city-level environmental instrument for PM2.5 using the industrial share of gross
measures, coded as a binary indicator taking the value domestic product (GDP) in each city. The rationale is
1 for cities implementing substantial air quality policies that cities with higher industrial output shares generate
after 2017. more emissions and thus higher pollution levels, but
The descriptive statistics reveal substantial variation conditional on overall economic development and
across cities and time periods. PM2.5 concentrations other controls, industrial composition should not
range from 23.4 μg/m to 48.3 μg/m , with a mean directly affect health outcomes except through pollution
3
3
of 33.45 μg/m – well above WHO guidelines. exposure.
3
Urbanization rates vary from 51.8% to 91.0%, reflecting Our structural equation (second stage) is:
differences between established metropolitan areas
and emerging secondary cities. Respiratory disease HealthOut oc me = α 0 α + 1 it α 2 X it +
. 25 + PM
it
rates show considerable variation, ranging from 116.9 µ ∂ + ε + (II)
to 178.7/1,000 population, suggesting significant i t it
differences in health outcomes across urban areas. Where HealthOutcome represents respiratory
it
disease rates; PM 2.5 is the instrumented value of
3.2. Econometric framework it
To address our research questions systematically, we PM2.5 concentration; X is a vector of control variables;
it
employed a two-stage analytical approach. First, we μ represents city fixed effects; ∂ represents year fixed
i
t
examine the effect of urbanization on air pollution using effects; and ε is the error term.
it
panel data methods. Second, we assessed the causal The first-stage equation is:
impact of air pollution on public health outcomes using PM2.5 = γ + γ IndustryShare + γ X + θ + λ + Ω it
it
i
t
it
1
it
0
2
IV techniques to address endogeneity concerns. (III)
Volume 22 Issue 3 (2025) 202 doi: 10.36922/AJWEP025130088