
Page 210 - AJWEP-v22i3
P. 210
Hung and Nghiem
urbanization rate associates with a 0.542 μg/m increase associates with higher PM2.5 levels. This finding is
3
in PM2.5 Column 2 adds basic controls and year fixed consistent with Vietnam remaining on the ascending
effects, slightly reducing the coefficient to 0.496 but portion of the environmental Kuznets curve, where
maintaining high statistical significance. industrialization and increased consumption outpace
Most importantly, columns 3 and 4 present fixed- environmental improvements.
effect specifications that control for unobserved The policy implementation variable shows a negative
time-invariant city characteristics. In our preferred coefficient (−1.495, significant at 5%), suggesting
specification with fixed effects and full controls (column that cities implementing air quality measures after
4), a 1%point increase in urbanization rate associates 2017 experienced PM2.5 reductions of approximately
with a 0.357 μg/m increase in PM2.5 concentration. 1.5 μg/m relative to cities without such policies. While
3
3
This estimate is somewhat lower than the OLS results, statistically significant, this reduction represents only
suggesting that unobserved city characteristics were about 4 – 5% of average PM2.5 levels, indicating modest
creating some upward bias in the simple correlation. policy effectiveness to date.
The fixed-effect estimate represents the within-city We also examined urbanization effects on other
relationship over time – as individual cities become pollutants where data permitted. For the subset of five cities
more urbanized, their pollution levels increase by with consistent NO2 monitoring, urbanization showed
approximately 0.36 μg/m per percentage point of a positive and significant association (approximately
3
urbanization. Given that our sample cities experienced 0.15 ppb increase per percentage point of urbanization,
urbanization increases ranging from 5 to 15% points p<0.05). Similarly, urbanization demonstrated positive
over the study period, this implies pollution increases of associations with SO2 levels, though estimates were less
2 – 5 μg/m attributable to urbanization alone. precise due to inconsistent monitoring coverage.
3
Control variables provide additional insights into
pollution determinants. GDP per capita enters with a 4.2. Air pollution and health outcomes
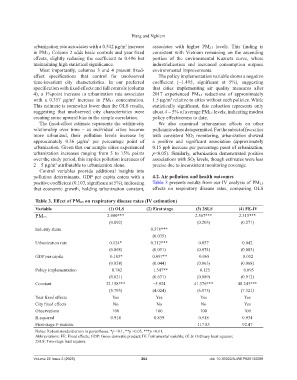
positive coefficient (0.103, significant at 5%), indicating Table 3 presents results from our IV analysis of PM2.5
that economic growth, holding urbanization constant, effects on respiratory disease rates, comparing OLS
Table 3. Effect of PM2.5 on respiratory disease rates (IV estimation)
Variable (1) OLS (2) First stage (3) 2SLS (4) FE-IV
2.980*** 2.567*** 2.315***
PM2.5
(0.092) (0.203) (0.271)
Industry share 0.378***
(0.035)
Urbanization rate 0.124* 0.312*** 0.057 0.042
(0.068) (0.051) (0.074) (0.083)
GDP per capita 0.103* 0.097** 0.068 0.052
(0.058) (0.044) (0.063) (0.068)
Policy implementation −0.742 −1.547** −0.125 −0.095
(0.821) (0.631) (0.889) (0.912)
Constant 32.158*** −5.924 41.376*** 48.243***
(5.793) (4.024) (6.875) (7.321)
Year fixed effects Yes Yes Yes Yes
City fixed effects No No No Yes
Observations 100 100 100 100
R-squared 0.914 0.839 0.918 0.934
First-stage F-statistic 117.83 92.47
Notes: Robust standard errors in parentheses. *p <0.1, **p <0.05, ***p <0.01.
Abbreviations: FE: Fixed effects; GDP: Gross domestic product; IV: Instrumental variable; OLS: Ordinary least squares;
2SLS: Two-stage least squares.
Volume 22 Issue 3 (2025) 204 doi: 10.36922/AJWEP025130088