
Page 209 - AJWEP-v22i3
P. 209
Effects of urbanization on air and health
Where IndustryShareᵢₜ represents the percentage income, employment, or other pathways that we control
contribution of industrial activities to the city’s GDP. for in our specification.
The validity of our IV approach depends on two key
assumptions: relevance and the exclusion restriction. 4. Results
The relevance condition requires that industrial share
significantly affects PM2.5 levels, which we test through 4.1. Urbanization and air pollution
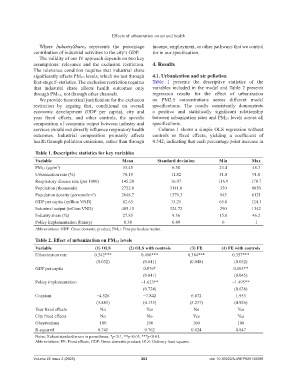
first-stage F-statistics. The exclusion restriction requires Table 1 presents the descriptive statistics of the
that industrial share affects health outcomes only variables included in the model and Table 2 presents
through PM2.5, not through other channels. regression results for the effect of urbanization
We provide theoretical justification for the exclusion on PM2.5 concentrations across different model
restriction by arguing that, conditional on overall specifications. The results consistently demonstrate
economic development (GDP per capita), city and a positive and statistically significant relationship
year fixed effects, and other controls, the specific between urbanization rates and PM2.5 levels across all
composition of economic output between industry and specifications.
services should not directly influence respiratory health Column 1 shows a simple OLS regression without
outcomes. Industrial composition primarily affects controls or fixed effects, yielding a coefficient of
health through pollution emissions, rather than through 0.542, indicating that each percentage point increase in
Table 1. Descriptive statistics for key variables
Variable Mean Standard deviation Min Max
PM2.5 (μg/m ) 33.45 6.58 23.4 48.3
3
Urbanization rate (%) 70.18 11.82 51.8 91.0
Respiratory disease rate (per 1000) 145.28 16.97 116.9 178.7
Population (thousands) 2722.0 3141.8 350 8950
Population density (persons/km ) 2648.7 1579.3 945 6121
2
GDP per capita (million VND) 82.63 15.21 65.0 124.3
Industrial output (trillion VND) 485.15 324.72 290 1342
Industry share (%) 27.85 9.36 15.0 46.2
Policy implementation (binary) 0.38 0.49 0 1
Abbreviations: GDP: Gross domestic product; PM2.5: Fine particulate matter.
Table 2. Effect of urbanization on PM2.5 levels
Variable (1) OLS (2) OLS with controls (3) FE (4) FE with controls
Urbanization rate 0.542*** 0.496*** 0.384*** 0.357***
(0.032) (0.041) (0.048) (0.052)
GDP per capita 0.076* 0.103**
(0.041) (0.045)
Policy implementation −1.623** −1.495**
(0.724) (0.638)
Constant −4.526 −7.842 6.872 1.953
(3.481) (4.135) (5.237) (4.926)
Year fixed effects No Yes No Yes
City fixed effects No No Yes Yes
Observations 100 100 100 100
R-squared 0.741 0.762 0.824 0.847
Notes: Robust standard errors in parentheses. *p<0.1, **p<0.05, ***p<0.01.
Abbreviations: FE: Fixed effects; GDP: Gross domestic product; OLS: Ordinary least squares.
Volume 22 Issue 3 (2025) 203 doi: 10.36922/AJWEP025130088