
Page 72 - AN-1-1
P. 72
Advanced Neurology Cortical thickness and regional homogeneity in CSVD
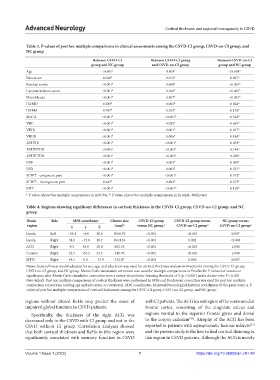
Table 3. P values of post hoc multiple comparisons in clinical assessments among the CSVD‑CI group, CSVD‑no‑CI group, and
NC group
Between CSVD‑CI Between CSVD‑CI group Between CSVD‑no‑CI
group and NC group and CSVD‑no‑CI group group and NC group
Age <0.001 a 0.803 a <0.001 a
Education 0.026 b 0.012 b 0.821 b
Fazekas scores <0.001 b 0.688 b <0.001 b
Lacunar infarcts count <0.001 b 0.166 b <0.001 b
Microbleeds <0.001 b 0.307 b <0.001 b
HAMD 0.385 b 0.003 b 0.024 b
HAMA 0.947 b 0.103 b 0.133 b
MoCA <0.001 b <0.001 b 0.524 b
VRC <0.001 b 0.035 b 0.481 b
VRIR <0.001 b 0.001 b 0.017 b
VRDR <0.001 b 0.006 b 0.184 b
AVLTIR <0.001 b <0.001 b 0.052 b
AVLTSTDR <0.001 a <0.001 a 0.144 a
AVLTLTDR <0.001 a <0.001 a 0.298 a
DSF <0.001 b 0.003 b 0.965 b
DSB <0.001 b 0.003 b 0.531 b
SCWT - congruent part <0.001 b <0.001 b 0.742 b
SCWT - incongruent part 0.647 b 0.882 b 0.575 b
BNT <0.001 b <0.001 b 0.193 b
b
a : P value of post hoc multiple comparisons in ANOVA, : P value of post hoc multiple comparisons in Kruskal–Wallis test
Table 4. Regions showing significant differences in cortical thickness in the CSVD‑CI group, CSVD‑no‑CI group, and NC
group
Brain Side MNI coordinate Cluster size CSVD‑CI group CSVD‑CI group versus NC group versus
region x y Z (mm ) versus NC group a CSVD‑no‑CI group a CSVD‑no‑CI group a
2
Insula Left −35.4 −6.0 10.6 1066.79 <0.001 <0.001 0.007
Insula Right 34.8 −15.8 18.2 1064.36 <0.001 0.002 <0.001
ACG Right 9.5 36.8 30.0 682.55 <0.001 <0.001 1.000
Cuneus Right 22.7 −64.2 23.5 446.76 <0.001 <0.001 1.000
MTG Right 48.1 0.1 −17.9 332.47 <0.001 0.040 0.007
Notes: General linear model adjusted for sex, age, and education was used for cortical thickness analysis in FreeSurfer among the CSVD-CI group,
CSVD-no-CI group, and NC group. Monte Carlo simulation correction was used for multiple comparisons in FreeSurfer. P values for statistical
significance after Monte Carlo simulation correction were a vertex-wise/cluster-forming threshold of 3 (p < 0.001) and a cluster-wise P < 0.001
(two-tailed). Post hoc multiple comparisons of cortical thickness were performed in SPSS and Bonferroni correction was used for post hoc multiple
comparison corrections (adding age and education as covariates). MNI coordinates, Montreal Neurological Institute coordinates of the peak voxel. a: P
values of post hoc multiple comparisons of cortical thicknesses among the CSVD-CI group, CSVD-no-CI group, and NC group
regions without altered ReHo may predict the onset of with CI patients. The ACG is a subregion of the ventromedial
impaired global function in CSVD patients. frontal cortex, consisting of the cingulate sulcus and
Specifically, the thickness of the right ACG was regions ventral to the superior frontal gyrus and dorsal
[36]
decreased only in the CSVD with CI group and not in the to the corpus callosum . Atrophy of the ACG has been
[37]
CSVD without CI group. Correlation analyses showed reported in patients with asymptomatic lacunar infarcts
that both cortical thickness and ReHo in this region were and the present study is the first to find cortical thinning in
significantly associated with memory function in CSVD this region in CSVD patients. Although the ACG is mostly
Volume 1 Issue 1 (2022) 7 https://doi.org/10.36922/an.v1i1.48