
Page 70 - AN-1-1
P. 70
Advanced Neurology Cortical thickness and regional homogeneity in CSVD
Table 1. Details of missing data
CSVD‑CI CSVD‑no‑CI NC group
group (n=106) group (n=77) (n=121) n
n (missing) n (missing) (missing)
T1-weighted MRI 106 (0) 77 (0) 121 (0)
fMRI 94 (12) 70 (7) 106 (15)
Neuroimaging features 106 (0) 77 (0) 121 (0)
Sex 106 (0) 77 (0) 121 (0)
Age 104 (2) 76 (1) 120 (1)
Education 106 (0) 76 (1) 121 (0)
Vascular risk factors 106 (0) 77 (0) 121 (0)
HAMD 100 (6) 71 (6) 114 (7)
HAMA 99 (7) 71 (6) 114 (7)
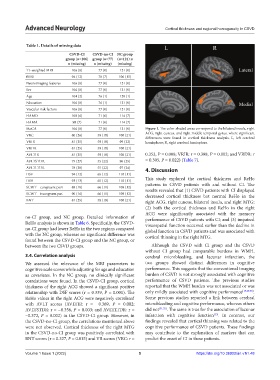
MoCA 106 (0) 77 (0) 121 (0) Figure 1. The color-shaded areas correspond to the bilateral insula, right
ACG, right cuneus, and right middle temporal gyrus, where significant
VRC 80 (26) 59 (18) 100 (21)
differences were found in cortical thickness analysis. L, left cerebral
VRIR 81 (25) 59 (18) 99 (22) hemisphere; R, right cerebral hemisphere.
VRDR 81 (25) 59 (18) 100 (21)
AVLTIR 81 (25) 59 (18) 100 (21) 0.353, P = 0.008; VRIR: r = 0.398, P = 0.002; and VRDR: r
AVLTSTDR 79 (27) 55 (22) 96 (25) = 0.305, P = 0.022) (Table 7).
AVLTLTDR 78 (28) 55 (22) 97 (24) 4. Discussion
DSF 94 (12) 65 (12) 110 (11)
DSB 93 (13) 65 (12) 110 (11) This study explored the cortical thickness and ReHo
SCWT – congruent part 88 (18) 66 (11) 109 (12) patterns in CSVD patients with and without CI. The
results revealed that (1) CSVD patients with CI displayed
SCWT – incongruent part 90 (16) 66 (11) 109 (12) decreased cortical thickness but normal ReHo in the
BNT 81 (25) 58 (19) 100 (21) right ACG, right cuneus, bilateral insula, and right MTG;
(2) both the cortical thickness and ReHo in the right
ACG were significantly associated with the memory
no-CI group, and NC group. Detailed information of performance of CSVD patients with CI; and (3) impaired
ReHo analysis is shown in Table 6. Specifically, the CSVD- visuospatial function occurred earlier than the decline in
no-CI group had lower ReHo in the two regions compared global function in CSVD patients and was associated with
with the NC group, whereas no significant difference was cortical thinning in the right MTG.
found between the CSVD-CI group and the NC group, or
between the two CSVD groups. Although the CSVD with CI group and the CSVD
without CI group had comparable burdens in WMH,
3.4. Correlation analysis cerebral microbleeding, and lacunar infarction, the
We assessed the relevance of the MRI parameters to two groups showed distinct differences in cognitive
cognitive scale scores while adjusting for age and education performance. This suggests that the conventional imaging
as covariates. In the NC group, no clinically significant burden of CSVD is not strongly associated with cognitive
correlations were found. In the CSVD-CI group, cortical performance of CSVD patients. The previous studies
thickness of the right ACG showed a significant positive reported that the WMH burden was not associated or was
relationship with DSF scores (r = 0.339, P = 0.001). The only mildly associated with cognitive performance [15,29,30] .
ReHo values in the right ACG were negatively correlated Some previous studies reported a link between cerebral
with AVLT scores (AVLTIR: r = −0.369, P = 0.002; microbleeding and cognitive performance, whereas others
AVLTSTDR: r = −0.356, P = 0.003; and AVLTLTDR: r = did not [31,32] . The same is true for the association of lacunar
−0.372, P = 0.002) in the CSVD-CI group. However, in infarction with cognitive function . In contrast, our
[33]
the CSVD-no-CI group, the correlations mentioned above findings revealed that cortical thinning was related to the
were not observed. Cortical thickness of the right MTG cognitive performance of CSVD patients. These findings
in the CSVD-no-CI group was positively correlated with may contribute to the explanation of markers that can
BNT scores (r = 0.327, P = 0.015) and VR scores (VRC: r = predict the onset of CI in these patients.
Volume 1 Issue 1 (2022) 5 https://doi.org/10.36922/an.v1i1.48