
Page 71 - AN-1-1
P. 71
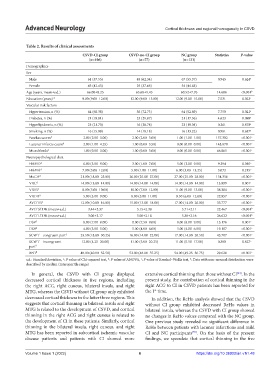
Advanced Neurology                                         Cortical thickness and regional homogeneity in CSVD


            Table 2. Results of clinical assessments
                                    CSVD‑CI group       CSVD‑no‑CI group      NC group      Statistics  P‑value
                                       (n=106)              (n=77)             (n=121)
            Demographics
            Sex
             Male                     61 (57.55)           48 (62.34)         67 (55.37)      0.945     0.624 a
             Female                   45 (42.45)           29 (37.66)         54 (44.63)
            Age (years, mean±s.d.)    66.00±8.25           65.68±9.45         60.52±7.76     14.686     <0.001 b
            Education (years)  d    9.00 (9.00–12.00)   12.00 (9.00–15.00)  12.00 (9.00–15.00)  7.531   0.023 c
            Vascular risk factors
             Hypertension, n (%)      64 (60.38)           56 (72.73)         64 (52.89)      7.750     0.021 a
             Diabetes, n (%)          21 (19.81)           23 (29.87)         21 (17.36)      4.623     0.099 a
             Hyperlipidemia, n (%)    23 (21.70)           16 (20.78)         23 (19.01)      0.261     0.878 a
             Smoking, n (%)           16 (15.09)           14 (18.18)         16 (13.22)      0.901     0.637 a
             Fazekas scores d       2.00 (2.00–3.00)     2.00 (2.00–3.00)   1.00 (1.00–1.00)  157.302   <0.001 c
             Lacunar infarcts count d  2.00 (1.00–4.25)  1.00 (0.00–3.50)   0.00 (0.00–0.00)  148.070   <0.001 c
             Microbleeds d          1.00 (0.00–3.00)     1.00 (0.00–3.00)   0.00 (0.00–0.00)  66.865    <0.001 c
            Neuropsychological data
             HAMD d                 6.00 (3.00–9.00)     3.00 (1.00–7.00)   5.00 (2.00–9.00)  9.294     0.010 c
             HAMA d                 7.00 (3.00–12.00)    5.00 (1.00–11.00)  6.00 (3.00–13.25)  3.072    0.215 c
             MoCA d                21.00 (18.00–23.00)  26.00 (25.00–27.00)  27.00 (25.00–28.00)  154.356  <0.001 c
             VRC d                 14.00 (13.00–14.00)  14.00 (14.00–14.00)  14.00 (14.00–14.00)  13.999  0.001 c
             VRIR d                 8.00 (5.00–10.00)   10.00 (7.00–12.00)  11.00 (9.00–13.00)  38.384  <0.001 c
             VRDR d                 5.00 (3.00–9.00)     8.00 (5.00–11.00)  9.50 (6.00–12.00)  22.957   <0.001 c
             AVLTIR d              12.00 (10.00–16.00)  15.00 (13.00–18.00)  17.00 (14.00–20.00)  35.777  <0.001 c
             AVLTSTDR (mean±s.d.)     3.44±2.37            5.15±2.38          5.71±2.11      22.467     <0.001 b
             AVLTLTDR (mean±s.d.)     3.06±2.17            5.00±2.18          5.38±2.16      26.622     <0.001 b
             DSF d                  8.00 (7.00–8.00)     8.00 (7.50–9.00)   8.00 (8.00–9.00)  15.176    0.001 c
             DSB d                  4.00 (3.00–5.00)     5.00 (4.00–6.00)   5.00 (4.00–6.00)  19.107    <0.001 c
             SCWT – congruent part d  23.50 (18.00–30.25)  16.00 (14.00–22.00)  17.00 (14.00–20.50)  45.707  <0.001 c
             SCWT – incongruent     12.00 (4.25–20.00)  11.00 (5.00–20.25)  11.00 (5.50–17.00)  0.380   0.827 c
             part d
             BNT d                 48.00 (40.00–52.50)  52.00 (48.00–55.25)  54.00 (49.25–56.75)  29.620  <0.001 c
            s.d.: Standard deviation,  : P value of Chi-squared test,  : P value of ANOVA,  : P value of Kruskal–Wallis test,  : Data with non-normal distribution were
                                                             c
                                                                                  d
                                               b
                            a
            described by median (interquartile range)
              In general, the CSVD with CI group displayed     extensive cortical thinning than those without CI . In the
                                                                                                      [34]
            decreased cortical  thickness  in five  regions,  including   present study, the contribution of cortical thinning in the
            the right ACG, right cuneus, bilateral insula, and right   right ACG to CI in CSVD patients has been reported for
                                                                   st
            MTG, whereas the CSVD without CI group only exhibited   the 1  time.
            decreased cortical thickness in the latter three regions. This   In addition, the ReHo analysis showed that the CSVD
            suggests that cortical thinning in bilateral insula and right   without CI group exhibited decreased ReHo values in
            MTG is related to the development of CSVD, and cortical   bilateral insula, whereas the CSVD with CI group showed
            thinning in the right ACG and right cuneus is related to   no changes in ReHo values compared with the NC group.
            the development of CI in these patients. Similarly, cortical   One previous study revealed no significant difference in
            thinning in the bilateral insula, right cuneus, and right   ReHo between patients with lacunar infarctions and mild
            MTG has been reported in subcortical ischemic vascular   CI and NC participants . On the basis of the present
                                                                                   [35]
            disease patients and patients with CI showed more   findings, we speculate that cortical thinning in the five

            Volume 1 Issue 1 (2022)                         6                        https://doi.org/10.36922/an.v1i1.48