
Page 73 - AN-1-1
P. 73
Advanced Neurology Cortical thickness and regional homogeneity in CSVD
involved in the regulation of executive function, emotional with CI. The higher local coherence of activity could be a
behavior, conflict, feedback, errors, and pain , increased sign of maladaptive brain activity and suggests functional
[36]
ACG activation had been reported to be associated with deterioration in CSVD patients with CI . In any case,
[14]
the retrieval of episodic memory . ACG infarction was decreased cortical thickness and normal ReHo in the
[38]
also found to result in working memory dysfunction , in right ACG may be of value in predicting the onset of CI in
[39]
accordance with our finding that ACG regulated memory CSVD patients.
processes. However, correlation analyses revealed that
higher ReHo values in the right ACG were associated Importantly, although the CSVD without CI group
with poorer memory function, including both short- retained normal global function, participants in this
term memory and long-term memory, in CSVD patients group exhibited impaired visuospatial function. In the
present study, CI was defined according to performance
in the MoCA test. The MoCA test has high sensitivity
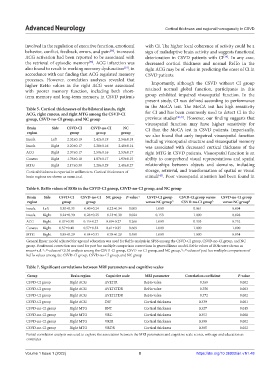
Table 5. Cortical thicknesses of the bilateral insula, right
ACG, right cuneus, and right MTG among the CSVD‑CI for CI and has been commonly used to detect CI in the
group, CSVD‑no‑CI group, and NC group previous studies [40,41] . However, our finding suggests that
visuospatial function may have higher sensitivity for
Brain Side CSVD‑CI CSVD‑no‑CI NC CI than the MoCA test in CSVD patients. Importantly,
region group group group we also found that early impaired visuospatial function
Insula Left 2.32±0.19 2.42±0.19 2.54±0.18 including visuospatial structure and visuospatial memory
Insula Right 2.20±0.17 2.28±0.16 2.40±0.14 was associated with decreased cortical thickness of the
ACG Right 2.37±0.17 2.50±0.16 2.53±0.17 right MTG in CSVD patients. Visuospatial function is an
Cuneus Right 1.76±0.18 1.87±0.17 1.93±0.15 ability to comprehend visual representations and spatial
MTG Right 2.17±0.30 2.28±0.29 2.48±0.27 relationships between objects and domains, including
Cortical thickness is reported in millimeters. Cortical thicknesses of storage, retrieval, and transformation of spatial or visual
[42]
brain regions are shown as mean±s.d. stimuli . Poor visuospatial attention had been found in
Table 6. ReHo values of ROIs in the CSVD‑CI group, CSVD‑no‑CI group, and NC group
Brain Side CSVD‑CI CSVD‑no‑CI NC group P‑value a CSVD‑CI group CSVD‑CI group versus CSVD‑no‑CI group
region group group versus NC group b CSVD‑no‑CI group b versus NC group b
Insula Left -0.30±0.33 -0.40±0.24 -0.22±0.34 0.005 1.000 0.061 0.004
Insula Right -0.24±0.30 -0.26±0.25 -0.13±0.30 0.024 0.153 1.000 0.028
ACG Right 0.07±0.30 0.15±0.27 0.09±0.27 0.266 1.000 0.333 0.752
Cuneus Right 0.57±0.40 0.57±0.32 0.61±0.35 0.669 1.000 1.000 1.000
MTG Right -0.85±0.29 -0.84±0.31 -0.78±0.29 0.580 1.000 1.000 0.934
General linear model adjusted for age and education was used for ReHo analysis in SPSS among the CSVD-CI group, CSVD-no-CI group, and NC
group. Bonferroni correction was used for post hoc multiple comparison corrections in general linear model. ReHo values of ROIs were shown as
mean±s.d. : P values of GLM analysis among the CSVD-CI group, CSVD-no-CI group, and NC group, : P values of post hoc multiple comparisons of
a
b
ReHo values among the CSVD-CI group, CSVD-no-CI group, and NC group
Table 7. Significant correlations between MRI parameters and cognitive scales
Group Brain region Cognitive scale MRI parameter Correlation coefficient P‑value
CSVD-CI group Right ACG AVLTIR ReHo value −0.369 0.002
CSVD-CI group Right ACG AVLTSTDR ReHo value −0.356 0.003
CSVD-CI group Right ACG AVLTLTDR ReHo value −0.372 0.002
CSVD-CI group Right ACG DSF Cortical thickness 0.339 0.001
CSVD-no-CI group Right MTG BNT Cortical thickness 0.327 0.015
CSVD-no-CI group Right MTG VRC Cortical thickness 0.353 0.008
CSVD-no-CI group Right MTG VRIR Cortical thickness 0.398 0.002
CSVD-no-CI group Right MTG VRDR Cortical thickness 0.305 0.022
Partial correlation analysis was used to explore the association between the MRI parameters and cognitive scale scores, with age and education as
covariates
Volume 1 Issue 1 (2022) 8 https://doi.org/10.36922/an.v1i1.48