
Page 112 - AN-3-2
P. 112
Advanced Neurology Cerebrovascular pathology biomarkers in post-COVID-19 patients
energy deficits, as well as water-electrolyte and metabolic and cells, some of which do not express the 80 kDa IL-6R,
disorders, which are crucial in treating the long-term thus explaining the pleiotropy and redundancy of the IL-6
consequences of COVID-19. Patients were prescribed a family of cytokines. 11
10
combination drug containing arginine hydrochloride and The presence of prolonged COVID-19 was verified
levocarnitine (Tivor-L), as well as a drug containing xylitol, after an average of 17 (range: 13 – 22) months. During
sodium acetate, and a balanced complex of electrolytes (sodium, this period, an increased number of monocytes and
calcium, potassium, and magnesium chlorides). A personalized cells producing IL-6 and TNFα was noted, which is
approach to treatment was essential, considering a wide range significantly associated with the long course of COVID-19
of complaints and the need for adjustment of chronic disease symptoms. Therefore, inflammation should be a target
12
treatment. Additional treatments for individuals in both for the treatment of chronic COVID-19.
groups with CVD focused on modifying risk factors for acute
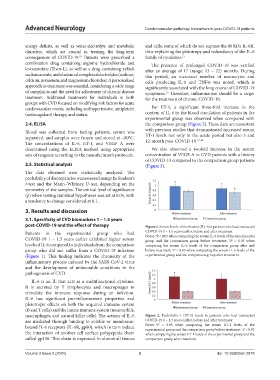
cardiovascular events, including antihypertensive, antiplatelet For ET-1, a significant three-fold increase in the
(anticoagulant) therapy, and statins. content of IL-6 in the blood circulation of patients in the
experimental group was observed when compared with
2.4. ELISA the comparison group (Figure 2). These data are consistent
Blood was collected from fasting patients, serum was with previous studies that demonstrated increased serum
separated, and samples were frozen and stored at −80°C. ET-1 levels not only in the acute period but also 3 and
13,14
The concentrations of IL-6, ET-1, and VEGF A were 12-month post-COVID-19.
determined using the ELISA method using appropriate We also observed a twofold increase in the serum
sets of reagents according to the manufacturer’s protocols. concentration of VEGF-A in CVD patients with a history
of COVID-19 compared to the comparison group patients
2.5. Statistical analysis (Figure 3).
The data obtained were statistically analyzed. The
probability of discrepancies was assessed using the Student’s
t-test and the Mann–Whitney U-test, depending on the
symmetry of the samples. The critical level of significance
(p) when testing statistical hypotheses was set at 0.05, with
a tendency to change considered at 0.1.
3. Results and discussion
3.1. Specificity of CVD biomarkers 1 – 1.5 years
post-COVID-19 and the effect of therapy Figure 1. Serum levels of interleukin (IL)-6 in patients who had contracted
Patients in the experimental group who had COVID-19 1 – 1.5 years earlier, before and after treatment
Notes: P < 0.05 when comparing the serum IL-6 levels of the experimental
a
COVID-19 1 – 1.5 years earlier exhibited higher serum group and the comparison group before treatment; P < 0.05 when
b
levels of IL-6 compared to individuals from the comparison comparing the serum IL-6 levels of the comparison group after and
group who did not suffer from a COVID-19 infection before treatment; P < 0.05 when comparing the serum IL-6 levels of the
c
(Figure 1). This finding indicates the chronicity of the experimental group and the comparison group after treatment.
inflammatory process induced by the SARS-CoV-2 virus
and the development of unfavorable conditions in the
pathogenesis of CVD.
IL-6 is an IL that acts as a multifunctional cytokine.
It is secreted by T lymphocytes and macrophages to
stimulate the immune response during an infection.
IL-6 has significant pro-inflammatory properties and
pleiotropic effects on both the acquired immune system
(B and T cells) and the innate immune system (neutrophils,
macrophages, and natural killer cells). The actions of IL-6 Figure 2. Endothelin-1 (ET-1) levels in patients who had contracted
are mediated through binding to soluble or membrane- COVID-19 1 – 1.5 years earlier, before and after treatment
a
bound IL-6 receptors (IL-6R, gp80), which in turn induce Notes: P < 0.05 when comparing the serum ET-1 levels of the
experimental group and the comparison group before treatment; P < 0.05
c
the interaction of another cell surface polypeptide chain when comparing the serum ET-1 levels of the experimental group and the
called gp130. This chain is expressed in almost all tissues comparison group after treatment.
Volume 3 Issue 2 (2024) 3 doi: 10.36922/an.2878