
Page 125 - AN-3-3
P. 125
Advanced Neurology Evaluating plausibility of thalamic model
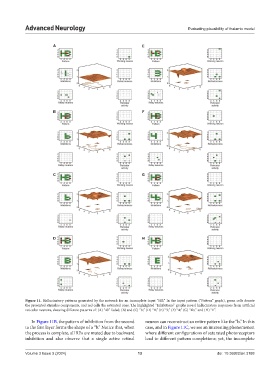
A E
B F
C G
D H
Figure 11. Hallucinatory patterns generated by the network for an incomplete input “HB.” In the input pattern (“Pattern” graph), green cells denote
the presented stimulus components, and red cells the saturated ones. The highlighted “Inhibitions” graphs reveal hallucinatory responses from artificial
reticular neurons, showing different patterns of: (A) “4b” faded; (B) and (C) “b;” (D) “B;” (E) “3;” (F) “4;” (G) “4b;” and (H) “E”.
In Figure 11B, the pattern of inhibition from the second neuron can reconstruct an entire pattern like the “b.” In this
to the first layer forms the shape of a “b.” Notice that, when case, and in Figure 11C, we see an interesting phenomenon
the process is complete, all REs are muted due to backward where different configurations of saturated photoreceptors
inhibition and also observe that a single active retinal lead to different pattern completions; yet, the incomplete
Volume 3 Issue 3 (2024) 13 doi: 10.36922/an.3188