
Page 124 - AN-3-3
P. 124
Advanced Neurology Evaluating plausibility of thalamic model
A D
B E
C F
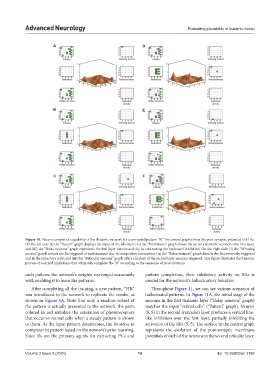
Figure 10. Pattern completion capability of the thalamic network for a corrupted pattern “B.” The central graphs show the post-synaptic potential of 81 Rs.
On the left side: (i) the “Pattern” graph displays the input of the REs layer; (ii) the “Inhibitions” graph shows the activity from the second to the first layer,
and (iii) the “Relay neurons” graph represents the first layer neuron activity by subtracting the backward inhibition. On the right side: (i) the “Winning
neuron” graph reveals the Rs triggered at each moment due to competitive interaction; (ii) the “Refractoriness” graph depicts the Rs previously triggered
and in the refractory state; and (iii) the “Reticular neurons” graph offers a history of the second layer neurons triggered. This figure illustrates the dynamic
process of overlaid inhibitions that ultimately complete the “B” according to the sequence of Rs activations.
each pattern, the network’s weights converged reasonably pattern completion, their inhibitory activity on REs is
well, enabling it to learn the patterns. crucial for the network’s hallucinatory behavior.
After completing all the training, a new pattern, “HB,” Throughout Figure 11, we can see various scenarios of
was introduced to the network to replicate the results, as hallucinated patterns. In Figure 11A, the initial stage of the
shown in Figure 4A. Note that only a random subset of neurons in the first thalamic layer (“Relay neurons” graph)
the pattern is actually presented to the network, the parts matches the input “retinal cells” (“Pattern” graph). Neuron
colored in red simulate the saturation of photoreceptors (8, 8) in the second (reticular) layer produces a vertical line-
that occur in retinal cells when a steady pattern is shown like inhibition over the first layer, partially inhibiting the
to them. As the input pattern deteriorates, the Rs strive to activation of the REs (5, 5). The surface in the central graph
complete the pattern based on the network’s prior learning. represents the evolution of the post-synaptic membrane
Since Rs are the primary agents for extracting PCs and potentials of each of the neurons in the second reticular layer.
Volume 3 Issue 3 (2024) 12 doi: 10.36922/an.3188