
Page 137 - AN-3-4
P. 137
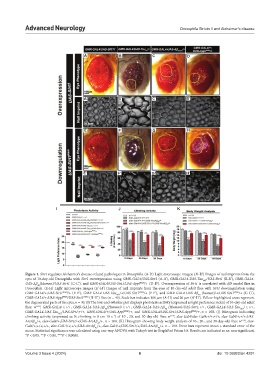
Advanced Neurology                                                Drosophila Sirtuin 1 and Alzheimer’s disease


                                     A              B             C              D


                                     A’            B’             C’            D’


                                     E             F              G              H


                                     E’            F’             G’            H’


                         I                         J                        K


            Figure 1. Sirt1 regulates Alzheimer’s disease-related pathologies in Drosophila. (A-D) Light microscope images; (A’-D’) Images of nail imprints from the
            eyes of 10-day-old Drosophila with Sirt1 overexpression using GMR-GAL4/UAS-Sirt1 (A-A’), GMR-GAL4-UAS-Tau /UAS-Sirt1 (B-B’), GMR-GAL4-
                                                                                       WT
            UAS-Aβ (Human)/UAS-Sirt1 (C-C’), and GMR-GAL4/UAS-Sirt1;UAS-Appl RNAi /+ (D-D’). Overexpression of Sirt1 is correlated with AD model flies in
                 42
            Drosophila. (E-H) Light microscope images (E’-H’) Images of nail imprints from the eyes of 10-day-old adult flies with Sirt1 downregulation using
            GMR-GAL4/+;UAS-Sirt1 RNAi /+ (E-E’), GMR-GAL4-UAS-Tau /+;UAS-Sirt1 RNAi /+ (F-F’), and GMR-GAL4-UAS-Aβ  (human)/+;UAS-Sirt1 RNAi /+ (G-G’),
                                                   WT
                                                                                     42
            GMR-GAL4/+;UAS-Appl RNAi /UAS-Sirt1 RNAi  (H-H’) flies (n = 40). Scale bar indicates 100 μm (A-H) and 20 μm (A’-H’). Yellow-highlighted areas represent
            the degenerated parts of the eyes, n = 40. (I) The box-and-whisker plot displays phototaxis activity (expressed as light preference index) of 10-day-old adult
            flies: w 1118 , GMR-GAL4/+;+/+, GMR-GAL4-UAS-Aβ (Human)/+;+/+, GMR-GAL4-UAS-Aβ  (Human)/UAS-Sirt1;+/+, GMR-GAL4-UAS-Tau /+;+/+,
                                                                                                       WT
                                              42
                                                                       42
            GMR-GAL4-UAS-Tau /UAS-Sirt1;+/+, GMR-GAL4/+;UAS-Appl RNAi /+, and  GMR-GAL4/UAS-Sirt1;UAS-Appl RNAi /+, n = 100. (J) Histogram indicating

                          WT
            climbing activity (expressed as % climbing in 8 cm 10 s ) of 10-, 20, and 30-day-old flies: w 1118 , elav-Gal4/elav-Gal4;+/+;+/+, elav-Gal4/+;+/+;UAS-
                                                 −1
            ArcAβ /+, elav-Gal4/+;UAS-Sirt1/+;UAS-ArcAβ /+. n = 100. (K) Histogram showing body weight analysis of 10-, 20-, and 30-day-old flies: w 1118 , elav-
                42
                                           42
            Gal4/+;+/+;+/+, elav-GAL4/+;+/+;UAS-ArcAβ /+, elav-Gal4/+;UAS-Sirt1/+;UAS-ArcAβ /+. n = 100. Error bars represent mean ± standard error of the
                                         42
                                                                    42
            mean. Statistical significance was calculated using one-way ANOVA with Tukey’s test in GraphPad Prism 5.0. Results are indicated as ns: non-significant,
            *P < 0.05, **P < 0.01, ***P < 0.0001.
            Volume 3 Issue 4 (2024)                         6                                doi: 10.36922/an.4291