
Page 139 - AN-3-4
P. 139
Advanced Neurology Drosophila Sirtuin 1 and Alzheimer’s disease
3.4. Improved AD-related pathologies were linked AD model flies exhibit rough eye phenotypes and motor
with reduced cell death in AD flies dysfunction, which are indicators of neuronal cell
Excessive cell death is a major factor in AD and plays an death (Figure 1 A‑H). 25-27,35 As discussed above, Sirt1
important role in the onset of AD-related pathologies. 42,43 overexpression reduces, while Sirt1 downregulation
A B C
D E F
G H I
J K L
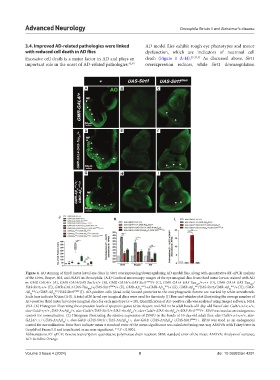
Figure 4. AO staining of third instar larval eye discs in Sirt1 overexpressing/downregulating AD model flies, along with quantitative RT-qPCR analysis
of the Grim, Reaper, Hid, and DIAP1 in Drosophila. (A-I) Confocal microscopy images of the eye imaginal disc from third instar larvae, stained with AO
in GMR-GAL4/+ (A), GMR-GAL4/UAS-Sirt1;+/+ (B), GMR-GAL4/+;UAS-Sirt1 RNAi /+ (C), GMR-GAL4-UAS-Tau /+;++ (D), GMR-GAL4-UAS-Tau /
WT
WT
UAS-Sirt1;+/+ (E), GMR-GAL4-UAS-Tau /+;UAS-Sirt1 RNAi /+ (F), GMR-Aβ 42 k52 /+;GMR-Aβ 42 k53 /+ (G), GMR-Aβ 42 k52 /UAS-Sirt1;GMR-Aβ 42 k53 /+ (H), GMR-
WT
Aβ 42 k52 /+;GMR-Aβ 42 k53 /UAS-Sirt1 RNAi (I). AO-positive cells (dead cells) located posterior to the morphogenetic furrow are marked by white arrowheads.
Scale bars indicate 50 μm (A-I). A total of 20 larval eye imaginal discs were used for the study. (J) Box-and-whisker plot illustrating the average number of
AO-positive third instar larval eye imaginal discs for each genotype (n = 20). Quantification of AO-positive cells was analyzed using ImageJ software, NIH,
USA. (K) Histogram illustrating the expression levels of apoptotic genes Grim, Reaper, and Hid in the adult heads of 0-day-old flies of elav-Gal4/+;+/+;+/+,
elav-Gal4/+;+/+, UAS-ArcAβ /+, elav-Gal4/+;UAS-Sirt1/+;UAS-ArcAβ /+, elav-Gal4/+;UAS-ArcAβ /+;UAS-Sirt1 RNAi /+. RP49 was used as an endogenous
42
42
42
control for normalization. (L) Histogram illustrating the relative expression of DIAP1 in the heads of 10-day-old adult flies: elav-Gal4/+;+/+;+/+, elav-
GAL4/+;+/+;UAS-ArcAβ /+, elav-Gal4/+;UAS-Sirt1/+;UAS-ArcAβ /+, elav-Gal4/+;UAS-ArcAβ /+;UAS-Sirt1 RNAi /+. RP49 was used as an endogenous
42
42
42
control for normalization. Error bars indicate mean ± standard error of the mean significance was calculated using one-way ANOVA with Tukey’s test in
GraphPad Prism 5.0 and is indicated as ns: non-significant, ***P < 0.0001.
Abbreviations: RT-qPCR: Reverse transcription-quantitative polymerase chain reaction; SEM: standard error of the mean; ANOVA: Analysis of variance;
AO: Acridine Orange.
Volume 3 Issue 4 (2024) 8 doi: 10.36922/an.4291