
Page 144 - AN-3-4
P. 144
Advanced Neurology Drosophila Sirtuin 1 and Alzheimer’s disease
Notch downregulation in the AD genetic background, the downregulation in the AD genetic background reduced
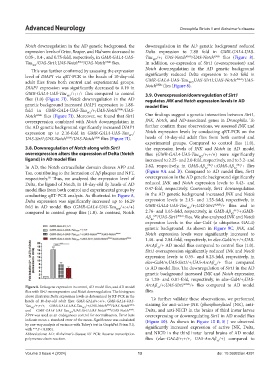
expression levels of Grim, Reaper, and Hid were decreased to Delta expression to 7.88 fold in GMR-GAL4-UAS-
0.05-, 0.4-, and 0.75-fold, respectively, in GMR-GAL4-UAS- Tau /+; UAS-Notch RNAi /UAS-Notch RNAi flies (Figure 8).
WT
Tau /UAS-Sirt1;UAS-Notch RNAi /UAS-Notch RNAi flies. In addition, co-expression of Sirt1 (overexpression) and
WT
This was further confirmed by assessing the expression Notch downregulation in the AD genetic background
level of DIAP1 via qRT-PCR in the heads of 10-day-old significantly reduced Delta expression to 5.63 fold in
RNAi
adult flies from both control and experimental groups. GMR-GAL4-UAS-Tau WT/ UAS-Sirt1;UAS-Notch /UAS-
RNAi
DIAP1 expression was significantly decreased to 0.19 in Notch flies (Figure 8).
GMR-GAL4-UAS-Tau /+;+/+ flies compared to control 3.9. Overexpression/downregulation of Sirt1
WT
flies (1.0) (Figure 7I). Notch downregulation in the AD regulates JNK and Notch expression levels in AD
genetic background increased DIAP1 expression to 1.88- model flies
fold in GMR-GAL4-UAS-Tau /+;UAS-Notch RNAi /UAS-
WT
Notch RNAi flies (Figure 7I). Moreover, we found that Sirt1 Our findings suggest a genetic interaction between Sirt1,
overexpression combined with Notch downregulation in JNK, Notch, and AD-associated genes in Drosophila. To
the AD genetic background significantly increased DIAP1 further confirm these observations, we assessed JNK and
expression up to 2.16-fold in GMR-GAL4-UAS-Tau / Notch expression levels by conducting qRT-PCR on the
WT
UAS-Sirt1;UAS-Notch RNAi /UAS-Notch RNAi flies (Figure 7I). heads of 10-day-old adult flies from both control and
experimental groups. Compared to control flies (1.0),
3.8. Downregulation of Notch along with Sirt1 the expression levels of JNK and Notch in AD model
overexpression alters the expression of Delta (Notch flies (GMR-GAL4-UAS-Tau /+;+/+) were significantly
WT
ligand) in AD model flies increased to 2.25- and 2.0-fold, respectively, and to 3.2- and
In AD, the Notch extracellular domain cleaves APP and 2.62, respectively, in GMR-Aβ 42 k52 /+;GMR-Aβ 42 k53 /+ flies
Tau, contributing to the formation of Aβ plaques and NFT, (Figure 9A and B). Compared to AD model flies, Sirt1
respectively. Thus, we analyzed the expression level of overexpression in the AD genetic background significantly
58
Delta, the ligand of Notch, in 10-day-old fly heads of AD reduced JNK and Notch expression levels to 0.43- and
model flies from both control and experimental groups by 0.47-fold, respectively. Conversely, Sirt1 downregulation
conducting qRT-PCR analysis. As illustrated in Figure 8, in the AD genetic background increased JNK and Notch
Delta expression was significantly increased up to 16.29 expression levels to 2.15- and 1.55-fold, respectively, in
fold in AD model flies (GMR-GAL4-UAS-Tau /+;+/+) GMR-GAL4-UAS-Tau /+;UAS-Sirt1 RNAi /+ flies and to
WT
WT
compared to control group flies (1.0). In contrast, Notch 2.76- and 1.65-fold, respectively, in GMR-Aβ 42 k52 /+;GMR-
Aβ 42 k53 /UAS-Sirt1 RNAi flies. We also analyzed JNK and Notch
expression levels in the elav-Gal4 (a ubiquitous GAL4)
genetic background. As shown in Figure 9C, JNK, and
Notch expression levels were significantly increased to
1.48- and 2.84-fold, respectively, in elav-Gal4/+;+/+;UAS-
ArcAβ /+ AD model flies compared to control flies (1.0).
42
Sirt1 overexpression significantly reduced JNK and Notch
expression levels to 0.55- and 0.23-fold, respectively, in
elav-Gal4/+;UAS-Sirt1/+;UAS-ArcAβ /+ flies compared
42
to AD model flies. The downregulation of Sirt1 in the AD
genetic background increased JNK and Notch expression
to 1.20- and 0.81-fold, respectively, in elav-Gal4/+;UAS-
Figure 8. Delta gene expression in control, AD model flies, and AD model ArcAβ /+;UAS-Sirt1 RNAi /+ flies compared to AD model
42
flies with Sirt1 overexpression and Notch downregulation. The histogram flies.
above illustrates Delta expression levels as determined by RT-PCR in the To further validate these observations, we performed
heads of 10-day-old adult flies: GMR-GAL4/+;+/+, GMR-GAL4-UAS-
Tau /+;+/+, GMR-GAL4-UAS-Tau /+;UAS-Notch RNAi /UAS-Notch RNAi, staining for anti-active-JNK (phosphorylated JNK), anti-
WT
WT
and GMR-GAL4-UAS-Tau /UAS-Sirt1;UAS-Notch RNAi /UAS-Notch RNAi . Delta, and anti-NICD in the brains of third instar larvae
WT
RP49 was used as an endogenous control for normalization. Error bars overexpressing or downregulating Sirt1 in AD model flies
indicate mean ± standard error of the mean. Significance was calculated (Figure 10). As shown in Figure 10 B, F, J we observed
by one-way analysis of variance with Tukey’s test in GraphPad Prism 5.0,
with ***P < 0.0001. significantly increased expression of active JNK, Delta,
Abbreviations: AD: Alzheimer’s disease; RT-PCR: Reverse transcription and NICD in the third instar larval brains of AD model
polymerase chain reaction. flies (elav-GAL4/+;+/+, UAS-ArcAβ /+) compared to
42
Volume 3 Issue 4 (2024) 13 doi: 10.36922/an.4291