
Page 138 - AN-3-4
P. 138
Advanced Neurology Drosophila Sirtuin 1 and Alzheimer’s disease
neuroprotective effect by lowering Aβ expression in the
42
larval brain of flies.
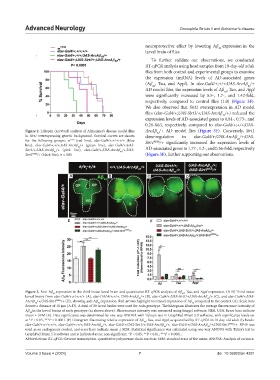
To further validate our observations, we conducted
RT-qPCR analysis using head samples from 10-day-old adult
flies from both control and experimental groups to examine
the expression (mRNA) levels of AD-associated genes
(Aβ , Tau, and Appl). In elav-Gal4/+;+/+;UAS-ArcAβ /+
42
42
AD model flies, the expression levels of Aβ , Tau, and Appl
42
were significantly increased by 8.5-, 1.7-, and 1.42-fold,
respectively, compared to control flies (1.0) (Figure 3F).
We also observed that Sirt1 overexpression in AD model
flies (elav-Gal4/+;UAS-Sirt1/+;UAS-ArcAβ /+) reduced the
42
expression levels of AD-associated genes to 0.81-, 0.73-, and
0.26-fold, respectively, compared to elav-Gal4/+;+/+;UAS-
Figure 2. Lifespan (survival) analysis of Alzheimer’s disease model flies ArcAβ /+ AD model flies (Figure 3F). Conversely, Sirt1
42
in Sirt1 overexpressing genetic background. Survival curves are shown downregulation in elav-Gal4/+;UAS-ArcAβ /+;UAS-
42
for the following groups: w 1118 (red line), elav-Gal4/+;+/+;+/+ (blue Sirt1 RNAi /+ significantly increased the expression levels of
line), elav-Gal4/+;+/+;UAS-ArcAβ /+ (green line), elav-Gal4/+;UAS-
42
Sirt1/+;UAS-ArcAβ /+ (pink line), elav-Gal4/+;UAS-ArcAβ /+;UAS- AD-associated genes to 1.77-, 1.2-, and 0.36-fold, respectively
42
42
Sirt1 RNAi /+ (black line), n = 100. (Figure 3F), further supporting our observations.
A B C D
E F
Figure 3. Anti-Aβ expression in the third instar larval brain and quantitative RT-qPCR analysis of Aβ , Tau, and Appl expression. (A-D) Third instar
42
42
larval brains from elav-Gal4/+;+/+;+/+ (A), elav-GAL4/+;+/+, UAS-ArcAβ /+ (B), elav-Gal4/+;UAS-Sirt1/+;UAS-ArcAβ /+ (C), and elav-Gal4/+;UAS-
42
42
ArcAβ /+;UAS-Sirt1 RNAi /+ (D), showing anti‑Aβ expression. Red arrows highlight increased expression of Aβ compared to the control (A). Scale bars
42
42
42
denote a distance of 10 μm (A-D). A total of 20 larval brains were used for each genotype. The histogram illustrates the average fluorescence intensity of
Aβ in the larval brains of each genotype (as shown above). Fluorescence intensity was measured using ImageJ software, NIH, USA. Error bars indicate
42
mean ± SEM (E). Data significance was determined by one-way ANOVA with Tukey’s test in GraphPad Prism 5.0 software, with significance levels set
at *P < 0.05, ***P < 0.0001. (F) Histogram illustrating relative expression of Aβ , Tau, and Appl, as quantified by RT-qPCR in 10-day-old adult fly heads:
42
elav-Gal4/+;+/+;+/+, elav-Gal4/+;+/+;UAS-ArcAβ /+, elav-Gal4/+;UAS-Sirt1/+;UAS-ArcAβ /+, elav-Gal4/+;UAS-ArcAβ /+;UAS-Sirt1 RNAi /+. RP49 was
42
42
42
used as an endogenous control, and error bars indicate mean ± SEM. Statistical significance was calculated using one-way ANOVA with Tukey’s test in
GraphPad Prism 5.0 software and is indicated as ns: non-significant, *P < 0.05, **P < 0.01, ***P < 0.0001.
Abbreviations: RT-qPCR: Reverse transcription-quantitative polymerase chain reaction; SEM: standard error of the mean; ANOVA: Analysis of variance.
Volume 3 Issue 4 (2024) 7 doi: 10.36922/an.4291