
Page 154 - AN-3-4
P. 154
Advanced Neurology Non-invasive electroencephalography in rats
A B C
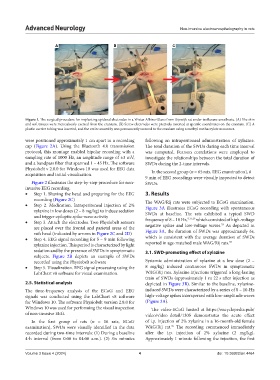
Figure 1. The surgical procedure for implanting epidural electrodes in a Wistar Albino Glaxo from Rijswijk rat under isoflurane anesthesia. (A) The skin
and soft tissues were meticulously excised from the cranium. (B) Screw electrodes were precisely inserted at specific coordinates on the cranium. (C) A
plastic carrier tubing was inserted, and the entire assembly was permanently secured to the cranium using a methyl methacrylate monomer.
were positioned approximately 1 cm apart in a recording following an intraperitoneal administration of xylazine.
cap (Figure 2A). Using the Bluetooth 4.0 transmission The total duration of the SWDs during each time interval
protocol, this montage enabled bipolar recording with a was computed. Pearson correlations were employed to
sampling rate of 1000 Hz, an amplitude range of ±3 mV, investigate the relationships between the total duration of
and a bandpass filter that spanned 1 – 45 Hz. The software SWDs during the 2-time intervals.
Physiobelt v 2.8.0 for Windows 10 was used for EEG data In the second group (n = 65 rats, EEG examination), 6 –
acquisition and initial visualization.
9 min of EEG recordings were visually inspected to detect
Figure 2 illustrates the step-by-step procedure for non- SWDs.
invasive EEG recording.
• Step 1. Shaving the head and preparing for the EEG 3. Results
recording (Figure 2C)
• Step 2. Medication. Intraperitoneal injection of 2% The WAG/Rij rats were subjected to ECoG examination.
Figure 3A illustrates ECoG recording with spontaneous
xylazine in low doses (2 – 8 mg/kg) to induce sedation
and trigger epileptic spike-wave activity SWDs at baseline. The rats exhibited a typical SWD
9,11,29
• Step 3. Attach the electrodes. Two Physiobelt sensors frequency of 8 – 10 Hz, which consisted of high-voltage
negative spikes and low-voltage waves. As depicted in
33
are placed over the frontal and parietal areas of the
rat’s head (indicated by arrows in Figure 2C and 2D) Figure 3A, the duration of SWDs was approximately 6s,
• Step 4. EEG signal recording for 5 – 9 min following which is consistent with the average duration of SWDs
34
xylazine injection. This period is characterized by light reported in age-matched male WAG/Rij rats.
sedation and by the presence of SWDs in symptomatic 3.1. SWD-promoting effect of xylazine
subjects. Figure 2B depicts an example of SWDs
recorded using the Physiobelt software Systemic administration of xylazine at a low dose (2 –
• Step 5. Visualization. EEG signal processing using the 8 mg/kg) induced continuous SWDs in symptomatic
LabChart v8 software for visual examination. WAG/Rij rats. Xylazine injections triggered a long-lasting
train of SWDs (approximately 1 m 22 s after injection as
2.5. Statistical analysis depicted in Figure 3B). Similar to the baseline, xylazine-
The time-frequency analysis of the ECoG and EEG induced SWDs were characterized by a series of 8 – 10-Hz
signals was conducted using the LabChart v8 software high-voltage spikes interspersed with low-amplitude waves
for Windows 10. The software Physiobelt version 2.8.0 for (Figure 3A).
Windows 10 was used for performing the visual inspection The video-ECoG hosted at https://encyclopedia.pub/
of non-invasive EEG. video/video_detail/1305 demonstrates the acute effect
In the first group of rats (n = 16 rats, ECoG of i.p. injection of 2% xylazine in a 16-month-old female
35
examination), SWDs were visually identified in the data WAG/Rij rat. The recording commenced immediately
recorded during two-time intervals: (1) During a baseline after the i.p. injection of 2% xylazine (2 mg/kg).
4-h interval (from 0:00 to 04:00 a.m.). (2) Six minutes Approximately 1 minute following the injection, the first
Volume 3 Issue 4 (2024) 4 doi: 10.36922/an.4464