
Page 118 - AN-4-3
P. 118
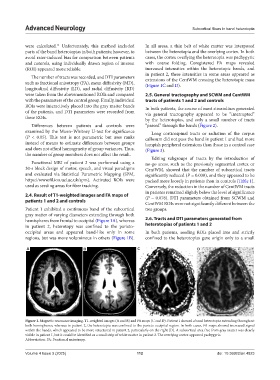
Advanced Neurology                                                     Subcortical fibers in band heterotopia


            were calculated.  Unfortunately, this method included   In all areas, a thin belt of white matter was interposed
                         15
            parts of the band heterotopias in both patients; however, to   between the heterotopia and the overlying cortex. In both
            avoid rater-induced bias for comparison between patients   cases, the cortex overlying the heterotopia was pachygyric
            and controls, using individually drawn region of interest   with  coarse  folding.  Coregistered FA  maps  revealed
            (ROI) appeared more reliable.                      increased intensities within the heterotopic bands, and
                                                               in patient 2, these  intensities in  some areas appeared as
              The number of tracts was recorded, and DTI parameters
            such as fractional anisotropy (FA), mean diffusivity (MD),   extensions of the CentWM crossing the heterotopic mass
                                                               (Figure 1C and D).
            longitudinal diffusivity (LD), and radial diffusivity (RD)
            were taken from the abovementioned ROIs and compared   2.5. General tractography and SCWM and CentWM
            with the parameters of the control group. Finally, individual   tracts of patients 1 and 2 and controls
            ROIs were interactively placed into the gray matter bands   In both patients, the course of most streamlines generated
            of the patients, and DTI parameters were recorded from   via general tractography appeared to be “interrupted”
            these ROIs.                                        by the heterotopias, and only a small number of tracts
              Differences between patients and controls were   “passed” through the bands (Figure 2).
            examined by the Mann–Whitney U-test for significance   Long corticospinal tracts or radiation of the corpus
            (P < 0.05). This test is not parametric but uses ranks   callosum did not pass the band in patient 1 and had more
            instead of means to estimate differences between groups   lumpish peripheral extensions than those in a control case
            and does not afford homogeneity of group variances. Thus,   (Figure 3).
            the number of group members does not affect the result.
                                                                 Editing subgroups of tracts by the introduction of
              Functional MRI of patient 2 was performed using a   no-go areas, such as the previously segmented cortex or
            30-s block design of motor, speech, and visual paradigms   CentWM, showed that the number of subcortical tracts
            and evaluated via Statistical Parametric Mapping (SPM,   significantly reduced (P = 0.030), and they appeared to be
            https://www.fil.ion.ucl.ac.uk/spm). Activated ROIs were   packed more loosely in patients than in controls (Table 1).
            used as seeding areas for fiber tracking.          Conversely, the reduction in the number of CentWM tracts
                                                               in patients remained slightly below the level of significance
            2.4. Result of T1-weighted images and FA maps of   (P = 0.076). DTI parameters obtained from SCWM and
            patients 1 and 2 and controls
                                                               CentWM ROIs were not significantly different between the
            Patient 1 exhibited a continuous band of the subcortical   two groups.
            gray matter of varying diameters extending through both
            hemispheres from frontal to occipital (Figure 1A), whereas   2.6. Tracts and DTI parameters generated from
            in patient 2, heterotopy was confined to the parieto-  heterotopias of patients 1 and 2
            occipital areas and appeared band-like only in some   In both patients, seeding ROIs placed into and strictly
            regions, but was more voluminous in others (Figure 1B).   confined to the heterotopias gave origin only to a small

            A                        B                     C                         D


            Figure 1. Magnetic resonance imaging. T1-weighted images (A and B) and FA maps (C and D). Patient 1 showed a band heterotopia extending throughout
            both hemispheres, whereas in patient 2, the heterotopia was confined to the parieto-occipital region. In both cases, FA maps showed increased signal
            within the bands, which appeared to be more structured in patient 2, particularly on the right (D). A subcortical area free from gray matter was clearly
            visible in patient 1, but it could be identified as a small strip of white matter in patient 2. The overlying cortex appeared pachygyric.
            Abbreviation: FA: Fractional anisotropy.

            Volume 4 Issue 3 (2025)                        112                               doi: 10.36922/an.4823