
Page 100 - AN-4-4
P. 100
Advanced Neurology Diffusion model for brain tumor classification
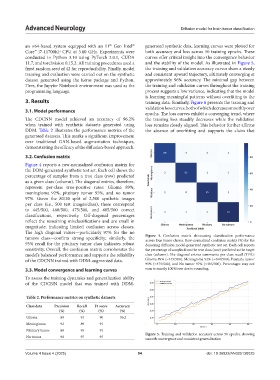
an ×64-based system equipped with an 11 Gen Intel generated synthetic data, learning curves were plotted for
th
Core™ i7-11700KF CPU at 3.60 GHz. Experiments were both accuracy and loss across 50 training epochs. These
conducted in Python 3.10 using PyTorch 2.0.1, CUDA curves offer critical insight into the convergence behavior
11.7, and torchvision 0.15.2. All training procedures used a and the stability of the model. As illustrated in Figure 5,
fixed random seed of 42 for reproducibility. Finally, model the training and validation accuracy curves show a steady
training and evaluation were carried out on the synthetic and consistent upward trajectory, ultimately converging at
dataset generated using the Keras package and Python. approximately 96% accuracy. The minimal gap between
Here, the Jupyter Notebook environment was used as the the training and validation curves throughout the training
programming language. process suggests a low variance, indicating that the model
is learning meaningful patterns without overfitting to the
3. Results training data. Similarly, Figure 6 presents the training and
validation loss curves, both of which decrease smoothly over
3.1. Model performance
epochs. The loss curves exhibit a converging trend, where
The CDCNN model achieved an accuracy of 96.2% the training loss steadily decreases while the validation
when trained with synthetic datasets generated using loss remains closely aligned. This behavior further affirms
DDM. Table 2 illustrates the performance metrics of the the absence of overfitting and supports the claim that
generated datasets. This marks a significant improvement
over traditional GAN-based augmentation techniques,
demonstrating the efficacy of the diffusion-based approach.
3.2. Confusion matrix
Figure 4 reports a row-normalized confusion matrix for
the DDM-generated synthetic test set. Each cell shows the
percentage of samples from a true class (row) predicted
as a given class (column). The diagonal entries, therefore,
represent per-class true-positive rates: Glioma 89%,
meningioma 92%, pituitary tumor 95%, and no tumor
97%. Given the 80/20 split of 2,500 synthetic images
per class (i.e., 500 test images/class), these correspond
to 445/500, 460/500, 475/500, and 485/500 correct
classifications, respectively. Off-diagonal percentages
reflect the remaining misclassifications and are small in
magnitude, indicating limited confusion across classes.
The high diagonal values—particularly 97% for the no
tumors class—confirm strong specificity; similarly, the Figure 4. Confusion matrix showcasing classification performance
across four tumor classes. Row-normalized confusion matrix (%) for the
95% recall for the pituitary tumor class indicates robust denoising diffusion model-generated synthetic test set. Each cell reports
sensitivity. Overall, the confusion matrix corroborates the the percentage of samples from the true class (row) predicted as the target
model’s balanced performance and supports the reliability class (column). The diagonal entries summarize per-class recall (TPR):
of the CDCNN trained with DDM-augmented data. Glioma 89% (≈445/500), Meningioma 92% (≈460/500), Pituitary tumor
95% (≈475/500), and No tumor 97% (≈485/500). Percentages may not
3.3. Model convergence and learning curves sum to exactly 100%/row due to rounding.
To assess the training dynamics and generalization ability
of the CDCNN model that was trained with DDM-
Table 2. Performance metrics on synthetic datasets
Class data Precision Recall F1 score Accuracy
(%) (%) (%) (%)
Glioma 89 91 90 96.2
Meningioma 92 89 91
Pituitary tumor 88 95 91
Figure 5. Training and validation accuracy across 50 epochs, showing
No tumor 98 97 97
smooth convergence and consistent generalization
Volume 4 Issue 4 (2025) 94 doi: 10.36922/AN025130025