
Page 98 - AN-4-4
P. 98
Advanced Neurology Diffusion model for brain tumor classification
Algorithm 1: Pseudocode for synthetic data generation (iii) Grayscale conversion and resizing: Images were
and model training converted to grayscale for consistency and resized
to standardized dimensions of 256 × 256 pixels to
for epoch in range(num_epochs): simplify computation.
for real_images in train_loader: (iv) Cropping: Unnecessary regions were cropped, focusing
noise = sample_gaussian_noise() the model’s attention on relevant areas of the brain.
synthetic_images = diffusion_model. (v) Data partitioning: The dataset was divided into
reverse_process(noise) training and testing subsets (80% training and 20%
combined_images = concatenate(real_ testing) to ensure balanced evaluation.
images, synthetic_images) This pre-processing pipeline ensured standardized,
predictions = CDCNN(combined_images) high-quality data for the effective training of the CDCNN
loss = cross_entropy(predictions, labels) model. The distribution of the datasets for training and
optimizer.zero_grad() testing the model is displayed in Table 1.
loss.backward()
optimizer.step() 2.4. CDCNN
The proposed CDCNN model can operate on both
2.3. Image pre-processing synthetic and real datasets, as described in past studies. It
8,52
Image pre-processing enhances crucial features and has four layers of convolution with a hierarchical degree of
reduces noise, ensuring better model performance. The feature extraction, three layers of max-pooling, a dropout
following steps were employed: regularization of dense layers to prevent overfitting,
(i) Contrast enhancement: Techniques were applied and a Softmax activation function to categorize multi-
to improve the visibility of critical features in brain class images by classifying them as glioma, meningioma,
tumor images, aiding better classification. pituitary tumor, and normal tissue. The output values were
(ii) Format conversion: PNG images were converted to then scaled into a probability distribution through scaling
JPG to ensure compatibility with CNN frameworks, 0–1 using the Softmax function. Equation VII was used
reduce file size, and standardize formats. to define the Softmax activation function:
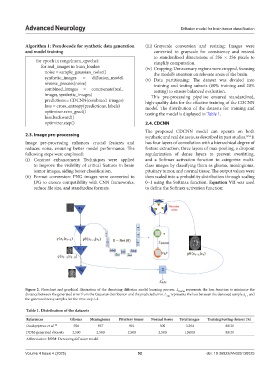
Figure 2. Flowchart and graphical illustration of the denoising diffusion model learning process. L DDPM represents the loss function to minimise the
distance between the generated error from the Gaussian distribution and the predicted error. L represents the loss between the denoised sample x and
t−1
Adv
the generated noisy samples for the time step t−1.
Table 1. Distribution of the datasets
References Glioma Meningioma Pituitary tumor Normal tissue Total images Training/testing dataset (%)
Onakpojeruo et al. 52 926 937 901 500 3,264 80/20
DDM-generated datasets 2,500 2,500 2,500 2,500 10,000 80/20
Abbreviation: DDM: Denoising diffusion model.
Volume 4 Issue 4 (2025) 92 doi: 10.36922/AN025130025