
Page 106 - ARNM-3-1
P. 106
Advances in Radiotherapy
& Nuclear Medicine Role of 18F-FDG in brown tumor detection
Following conservative treatment, an increase in CA15-3 showed a total calcium level of 116 mg/L (reference range:
levels at 73 U/mL (reference value <31.3 U/mL) and 80 – 105 mg/L) and a phosphorus level of 42 mg/L (reference
diffuse bone pain in 2018 suggested metastatic recurrence. range: 25 – 50 mg/L). The PTH level was abnormally
Bone scintigraphy indicated metabolic super scan with elevated at 1214 pg/mL (reference range: 15 – 68 pg/mL),
heterogeneous uptake in the skull. In addition to mediastinal confirming the diagnosis of secondary HPT. A cervical
and left internal mammary lymph node involvement, a CT ultrasound revealed a centimetric retrothyroid left mid-
scan revealed lytic lesions in the spine, sternum, and pelvic lobe nodular formation suggestive of a parathyroid nodule
bones. PET-CT scan showed metabolically active metastatic at this level. Whole-body scan with 99mTc-MIBI show
lesions in the left lung, liver segment IV, mediastinal lymph no definite suspicious focus suggestive of brown tumors,
nodes, and left internal mammary chain. Bone lesions except for physiological radiopharmaceutical uptake in
appeared hypermetabolic with lacunar lytic foci. The spine the parotid, submaxillary, hepatobiliary, and digestive
showed slightly more intense and heterogeneous uptake, regions (Figure 2A). 99m Tc-hexakis-methoxy-isobutyl
particularly with hypermetabolic chondrocostal and lower isonitrile ( Tc-MIBI) parathyroid scintigraphy showed
99m
jaw lesions, resembling a metabolically active, extensively a pathologically retained focus of 99m Tc-MIBI in the left
remodeled skeleton (Figure 1). A weakly hypermetabolic mid-lobe, with slightly delayed washout compared to the
retrothyroid left focus with maximum standardized uptake rest of the thyroid parenchyma, suggesting pathological
value (SUV ) = 3.3 suggested a parathyroid formation, parathyroid tissue, consistent with the results of cervical
max
necessitating additional ultrasound and parathyroid ultrasound (Figure 2B). Whole-body scanning at the end
scintigraphy. Concurrently, the phosphocalcic assessment of the examination showed two areas of very low and
A B
C
D
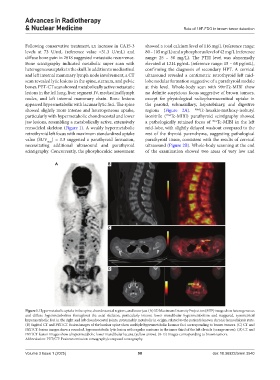
Figure 1. Hypermetabolic uptake in the spine, chondrocostal regions, and lower jaw. (A) 3D Maximum Intensity Projection (MIP) image show heterogeneous
and diffuse hypermetabolism throughout the axial skeleton, particularly intense lower mandibular hypermetabolism and staggered, symmetrical
hypermetabolic foci in the right and left chondrocostal joints, presumably metabolic in origin, related to the patient’s known chronic hemodialysis state.
(B) Sagittal CT and PET/CT fusion images of the lumbar spine show multiple hypermetabolic lacunar foci corresponding to brown tumors. (C) CT and
PET/CT fusion images show a rounded, hypermetabolic lytic lesion with regular contours in the inner third of the left clavicle (orange arrow). (D) CT and
PET/CT fusion images show a hypermetabolic lower mandibular lacuna (yellow arrow). (B-D) Images corresponding to brown tumors.
Abbreviation: PET/CT: Positron emission tomography/computed tomography.
Volume 3 Issue 1 (2025) 98 doi: 10.36922/arnm.3540