
Page 67 - ARNM-3-1
P. 67
Advances in Radiotherapy
& Nuclear Medicine Aspirin’s protective effect on RISI
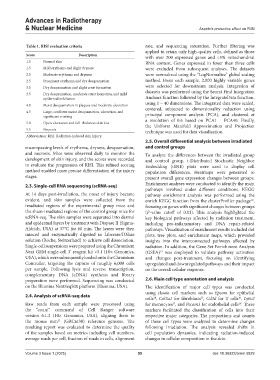
Table 1. RISI evaluation criteria rate, and sequencing saturation. Further filtering was
applied to retain only high-quality cells, defined as those
Score Description with over 200 expressed genes and <5% mitochondrial
1.0 Normal skin RNA content. Genes expressed in fewer than three cells
1.5 Mild erythema and slight dryness were excluded from subsequent analyses. The datasets
2.0 Moderate erythema and dryness were normalized using the “LogNormalize” global scaling
2.5 Prominent erythema and dry desquamation method. From each sample, 2,000 highly variable genes
3.0 Dry desquamation and slight crust formation were selected for downstream analysis. Integration of
3.5 Dry desquamation, moderate crust formation, and mild datasets was performed using the Seurat Find Integration
epidermal exfoliation Anchors function followed by the IntegrateData function,
using 1 – 40 dimensions. The integrated data were scaled,
4.0 Moist desquamation in plaques and moderate ulceration
4.5 Large, confluent moist desquamation, ulceration, and centered, subjected to dimensionality reduction using
significant crusting principal component analysis (PCA), and clustered at
5.0 Open ulceration and full-thickness skin loss a resolution of 0.6 based on PCA1 – PCA40. Finally,
the Uniform Manifold Approximation and Projection
5.5 Necrosis technique was used for data visualization.
Abbreviation: RISI: Radiation-induced skin injury.
2.5. Overall differential analysis between irradiated
encompassing levels of erythema, dryness, desquamation, and control groups
and necrosis. Mice were observed daily to monitor the To analyze the differences between the irradiated group
development of skin injury, and the scores were recorded and control group, t-Distributed Stochastic Neighbor
to evaluate the progression of RISI. This refined scoring Embedding (tSNE) plots were used to display cell
method enabled more precise differentiation of the injury population differences. Heatmaps were generated to
stages. present overall gene expression changes between groups.
2.3. Single-cell RNA sequencing (scRNA-seq) Enrichment analyses were conducted to identify the main
pathways involved under different conditions. KEGG
At 14 days post-irradiation, the onset of injury became pathway enrichment analysis was performed using the
evident, and skin samples were collected from the enrich KEGG function from the clusterProfiler package ,
12
irradiated regions of the experimental group mice and focusing on genes with significant changes between groups
the sham-irradiated regions of the control group mice for (P-value cutoff of 0.01). This analysis highlighted the
scRNA-seq. The skin samples were separated into dermal key biological pathways affected by radiation treatment,
and epidermal layers by treatment with Dispase II (Sigma- including pro-inflammatory and DNA repair-related
Aldrich, USA) at 37°C for 60 min. The layers were then pathways. Visualization of enrichment results included dot
minced and enzymatically digested in Liberase/DNase plots, tree plots, and enrichment maps, which provided
solution (Roche, Switzerland) to achieve cell dissociation. insights into the interconnected pathways affected by
Single-cell suspensions were prepared using the Chromium radiation. In addition, the Gene Set Enrichment Analysis
Next GEM single-cell 3’ reagent kit v3.1 (10× Genomics, (GSEA) was employed to validate pathway activation
13
USA), which were subsequently loaded onto the Chromium and changes post-treatment, focusing on identifying
Controller, targeting the capture of roughly 6,000 cells upregulated and downregulated pathways and their impact
per sample. Following lysis and reverse transcription, on the overall cellular response.
complementary DNA (cDNA) synthesis and library
preparation were performed. Sequencing was conducted 2.6. Main cell type annotation and analysis
on the Illumina NextSeq500 platform (Illumina, USA). The identification of major cell types was conducted
using classic cell markers such as Epcam for epithelial
2.4. Analysis of scRNA-seq data
cells , Col3a1 for fibroblasts , Cd3d for T cells , Ly6c2
15
14
16
Raw reads from each sample were processed using for monocytes , and Pecam1 for endothelial cells . These
17
18
the “count” command of Cell Ranger software markers facilitated the classification of cells into their
version 6.1.2 (10× Genomics, USA), aligning them to respective major categories. The proportions and counts
the mouse mm (GRCm38) reference genome. The of these cell types were analyzed to determine changes
11
resulting report was evaluated to determine the quality following irradiation. The analysis revealed shifts in
of the samples based on metrics including cell numbers, cell population dynamics, indicating radiation-induced
average reads per cell, fraction of reads in cells, alignment changes in cellular composition in the skin.
Volume 3 Issue 1 (2025) 59 doi: 10.36922/arnm.5829