
Page 69 - ARNM-3-1
P. 69
Advances in Radiotherapy
& Nuclear Medicine Aspirin’s protective effect on RISI
A B
C D
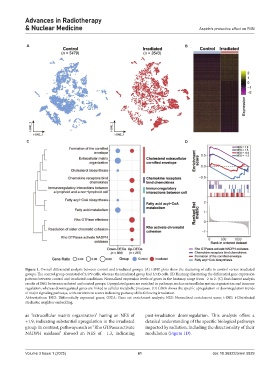
Figure 1. Overall differential analysis between control and irradiated groups. (A) t-SNE plots show the clustering of cells in control versus irradiated
groups. The control group consisted of 5,479 cells, whereas the irradiated group had 3,543 cells. (B) Heatmap illustrating the differential gene expression
patterns between control and irradiated conditions. Normalized expression levels of genes in the heatmap range from −2 to 2. (C) Enrichment analysis
results of DEG between irradiated and control groups. Upregulated genes are enriched in pathways such as extracellular matrix organization and immune
regulation, whereas downregulated genes are linked to cellular metabolic processes. (D) GSEA shows the specific upregulation or downregulation trends
of major signaling pathways, with enrichment scores indicating pathway shifts following irradiation.
Abbreviations: DEG: Differentially expressed genes; GSEA: Gene set enrichment analysis; NES: Normalized enrichment score; t-SNE: t-Distributed
stochastic neighbor embedding.
as “extracellular matrix organization” having an NES of post-irradiation downregulation. This analysis offers a
+1.9, indicating substantial upregulation in the irradiated detailed understanding of the specific biological pathways
group. In contrast, pathways such as “Rho GTPases activate impacted by radiation, including the directionality of their
NADPH oxidases” showed an NES of −1.3, indicating modulation (Figure 1D).
Volume 3 Issue 1 (2025) 61 doi: 10.36922/arnm.5829