
Page 71 - ARNM-3-1
P. 71
Advances in Radiotherapy
& Nuclear Medicine Aspirin’s protective effect on RISI
A B
C
D
E
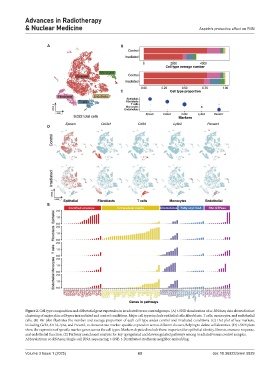
Figure 2. Cell type composition and differential gene expression in irradiated versus control groups. (A) t-SNE visualization of sc-RNAseq data shows distinct
clustering of major skin cell types in irradiated and control conditions. Major cell types include epithelial cells, fibroblasts, T cells, monocytes, and endothelial
cells. (B) Bar plot illustrates the number and average proportion of each cell type under control and irradiated conditions. (C) Dot plot of key markers,
including Cd34, Krt14, Ly6a, and Pecam1, to demonstrate marker-specific expression across different clusters, helping to define cell identities. (D) t-SNE plots
show the expression of specific marker genes across the cell types. Markers depicted include those important for epithelial identity, fibrosis, immune response,
and endothelial function. (E) Pathway enrichment analysis for key upregulated and downregulated pathways among irradiated versus control samples.
Abbreviations: sc-RNAseq: Single-cell RNA sequencing; t-SNE: t-Distributed stochastic neighbor embedding.
Volume 3 Issue 1 (2025) 63 doi: 10.36922/arnm.5829