
Page 72 - ARNM-3-2
P. 72
Advances in Radiotherapy
& Nuclear Medicine Modeling renal TAC in dynamic scintigraphy
indicates the rate at which the radiopharmaceutical is with the background on the scintigraphy frames, can
taken up by the kidney tissue. be performed using two methods: The free-hand
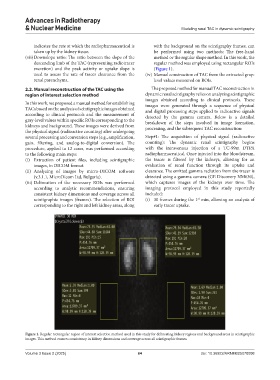
(vii) Downslope ratio: The ratio between the slope of the method or the regular shape method. In this work, the
descending limb of the TAC (representing radiotracer regular method was employed using rectangular ROIs
excretion) and the peak activity or uptake slope is (Figure 1).
used to assess the rate of tracer clearance from the (iv) Manual construction of TAC from the extracted gray-
renal parenchyma. level values measured on ROIs.
2.2. Manual reconstruction of the TAC using the The proposed method for manual TAC reconstruction in
region of interest selection method dynamic renal scintigraphy relies on analyzing scintigraphic
images obtained according to clinical protocols. These
In this work, we proposed a manual method for establishing images were generated through a sequence of physical
TACs based on the analysis of scintigraphic images obtained and digital processing steps applied to radioactive signals
according to clinical protocols and the measurement of detected by the gamma camera. Below is a detailed
gray-level values within specific ROIs corresponding to the breakdown of the steps involved in image formation,
kidneys and background. These images were derived from processing, and the subsequent TAC reconstruction:
the physical signal (radioactive counting) after undergoing
several processing and conversion steps (e.g., amplification, Step#1: The acquisition of physical signal (radioactive
gain, filtering, and analog-to-digital conversion). The counting): The dynamic renal scintigraphy begins
procedure, applied to 12 cases, was performed according with the intravenous injection of a TC-99m DTPA
to the following main steps: radiopharmaceutical. Once injected into the bloodstream,
(i) Extraction of patient files, including scintigraphic the tracer is filtered by the kidneys, allowing for an
images, in DICOM format. evaluation of renal function through its uptake and
(ii) Analyzing of images by micro-DICOM software clearance. The emitted gamma radiation from the tracer is
(v.3.1.1, MicroDicom Ltd, Bulgaria). detected using a gamma camera (GE Discovery NM630),
(iii) Delineation of the necessary ROIs was performed which captures images of the kidneys over time. The
according to analytic recommendations, ensuring imaging protocol employed in this study reportedly
consistent kidney dimensions and coverage across all included:
scintigraphic images (frames). The selection of ROI (i) 30 frames during the 1 min, allowing an analysis of
st
corresponding to the right and left kidney areas, along early tracer uptake.
Figure 1. Regular rectangular region of interest selection method used in this study for delineating kidney regions and background areas in scintigraphic
images. This method ensures consistency in kidney dimensions and coverage across all scintigraphic frames.
Volume 3 Issue 2 (2025) 64 doi: 10.36922/ARNM025070008