Page 77 - ARNM-3-2
P. 77

Advances in Radiotherapy
            & Nuclear Medicine                                                Modeling renal TAC in dynamic scintigraphy


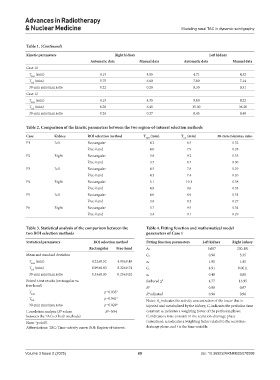
            Table 1. (Continued)
            Kinetic parameters                    Right kidney                            Left kidney
                                        Automatic data      Manual data        Automatic data       Manual data
            Case 11
             T  (min)                       4.15               4.05                4.71                4.32
              max
             T  (min)                       5.75               6.60                7.00                7.14
              1/2
             30-min min/max ratio           0.22               0.28                0.30                0.31
            Case 12
             T  (min)                       4.15               4.35                9.00                9.22
              max
             T  (min)                       6.20               6.45                35.00               36.20
              1/2
             30-min min/max ratio           0.26               0.27                0.45                0.48

            Table 2. Comparison of the kinetic parameters between the two region-of-interest selection methods

            Case        Kidney        ROI selection method    T  (min)        T  (min)       30-min min/max ratio
                                                               max             1/2
            P1          Left          Rectangular                4.2            8.5                 0.32
                                      Free-hand                  4.0            7.9                 0.28
            P2          Right         Rectangular                3.8            9.2                 0.35
                                      Free-hand                  3.5            8.7                 0.30
            P3          Left          Rectangular                4.5            7.8                 0.29
                                      Free-hand                  4.3            7.4                 0.26
            P4          Right         Rectangular                5.1            10.1                0.38
                                      Free-hand                  4.8            9.6                 0.33
            P5          Left          Rectangular                4.0            8.9                 0.31
                                      Free-hand                  3.8            8.2                 0.27
            P6          Right         Rectangular                3.7            9.5                 0.34
                                      Free-hand                  3.4            9.1                 0.29


            Table 3. Statistical analysis of the comparison between the   Table 4. Fitting function and mathematical model
            two ROI selection methods                          parameters of Case 1

            Statistical parameters       ROI selection method  Fitting function parameters  Left kidney  Right kidney
                                       Rectangular  Free-hand  A0                        5,687        200,181
            Mean and standard deviation                        Ce                         0.98         3.35
             T  (min)                   4.22±0.52  4.00±0.49   αe                         1.90         1.45
              max
             T  (min)                   8.99±0.83  8.32±0.74   Cs                         4.91        0.0011
              1/2
             30-min min/max ratio       0.33±0.03  0.29±0.02   αs                         0.48         0.88
            Paired t-test results (rectangular vs.             Reduced χ 2                4.77         13.95
            free-hand)
                                                               R 2                        0.98         0.97
             T                               p=0.035*
                                                                2
              max                                              R  adjusted                0.98         0.96
             T                               p=0.041*
              1/2                                              Notes: A  indicates the activity concentration of the tracer that is
                                                                     0
             30-min min/max ratio            p=0.029*          injected and metabolized by the kidney; Ce indicates the perfusion time
                                               2
            Correlation analysis (R  values   R =0.94          constant; αe indicates a weighting factor of the perfusion phase;
                           2
            between the TACs of both methods)                  Cs indicates a time constant in the secretion-drainage phase
            Note: *p<0.05.                                     (urination); αs indicates a weighting factor related to the secretion-
            Abbreviations: TAC: Time-activity curve; ROI: Region-of-interest.  drainage phase, and t is the time variable.


            Volume 3 Issue 2 (2025)                         69                        doi: 10.36922/ARNM025070008
   72   73   74   75   76   77   78   79   80   81   82