
Page 74 - ARNM-3-2
P. 74
Advances in Radiotherapy
& Nuclear Medicine Modeling renal TAC in dynamic scintigraphy
(i) The measurements are conducted under the condition At (1 e− − kt ) e× − k 2 .t
( ) A=
1 .
that physiological processes remain in a steady state 0 (III)
throughout the experiment; In this work, instead of using the analytical solution
(ii) The radioligand used does not significantly affect the given by Equation III, an empirical solution was adopted
physiological or biochemical processes being studied; and based on imaging data and the manual reconstruction of the
(iii) The homogeneity of the tracer concentration is within TAC. Following multiple trials and with consideration of
each compartment. renal physiology and function, the manually reconstructed
Commonly, a compartmental model is defined by
a system of differential equations where each equation TAC was fitted using a suitable mathematical function.
This fitting function describes the variation of gray level
corresponds to the sum of all transfer rates to and from a
specific compartment: over time and is presented in Equation IV:
A
dC i ( )t = ∑ N kC kC ( ) t GL = C 0 t (IV)
≠
e α
(1
dt i= 1 ij j ( ) t − ij i ij (I) (1+ t e ) ++ C s ) s α
Where C(t) is the tracer concentration in compartment
i
i, k is the transfer rate constant to compartment i from Where GL is the gray level of a separated frame, A
0
ij
compartment j, and N is the number of compartments in is the activity concentration of the tracer that is injected
the model. and metabolized by the kidney, C is the perfusion time
e
constant, α is a weighting factor of the perfusion phase,
e
In this work, a one-compartment model was used. This C is a time constant in the secretion-drainage phase
s
model assumes that the system used in this study comprises (urination), α is a weighting factor related to the secretion-
s
only one homogenous compartment (Figure 2). After the drainage phase, and t is the time variable.
administration via an extravascular route, the radioactive
tracer transfer through the kidney proceeds as follows: 14 3. Results
dC CE ( )t = kC k C ( )t Figure 3 demonstrates an example of clinical (machine)
dt 1 P ( ) t − 2 CE (II) and manually reconstructed TACs of Case 1.
Where k is related to the glomerular filtration and equal to Figure 4 shows the TAC modeling for Case 1 using the
1
the ratio of GFR to the extravascular functional renal cortical mathematical fitting function (Equation IV) based on the
volume (GFR/V ), 15-17 k is related to the urination, C is the one-compartment model.
P
2
EC
plasma activity concentration, and C is the extravascular Table 1 compares the kinetic parameters of the renal
EC
functional renal cortical activity concentration. function automatically generated by the scintigraphy
The solution to the differential equation (Equation II), machine’s algorithm with those manually extracted using
which describes the variation of activity (A(t)) as a function the proposed model.
of time (t), is given by the following equation: 14 Manually reconstructed renal TACs were found to
be dependent on the ROI selection methods. While
the results obtained using the manual method were
accurate and of good quality, the free-hand selection
method is believed to offer better results, particularly for
mathematical modeling and data fitting. This approach
may enhance the accuracy of the main kinetic parameters
extracted from the data. Moreover, the renal function
curves established manually using gray-level values from
individual scintigraphic images exhibited better dynamic
behavior than those from the machine (automatic), which
are based on radioactive counting. This difference is due to
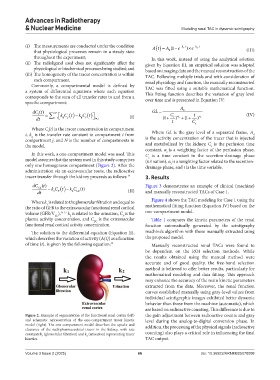
Figure 2. Example of segmentation of the functional renal cortex (left) the gain adjustment between radioactive counts and gray
and schematic representation of the one-compartment tracer kinetic level during the analog-to-digital conversion phase. In
model (right). The one-compartment model describes the uptake and addition, the processing of the physical signals (radioactive
clearance of the radiopharmaceutical tracer in the kidney, with rate
constants k (glomerular filtration) and k (urination) representing tracer counting) also plays a critical role in influencing the final
1
2
kinetics. TAC output.
Volume 3 Issue 2 (2025) 66 doi: 10.36922/ARNM025070008