
Page 26 - BH-1-1
P. 26
Brain & Heart Cerebral venous thrombosis mimicking brain tumors
A B
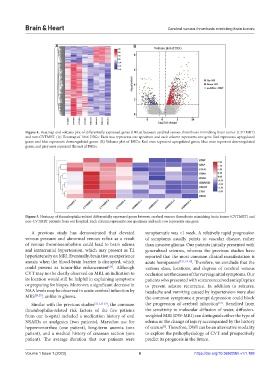
Figure 4. Heatmap and volcano plot of differentially expressed genes (DEGs) between cerebral venous thrombosis mimicking brain tumor (CVTMBT)
and non-CVTMBT. (A) Heatmap of 1066 DEGs: Each row represents one specimen and each column represents one gene. Red represents upregulated
genes and blue represents downregulated genes. (B) Volcano plot of DEGs: Red ones represent upregulated genes, blue ones represent downregulated
genes, and grey ones represent the rest of DEGs.
Figure 5. Heatmap of thrombophilia-related differentially expressed genes between cerebral venous thrombosis mimicking brain tumor (CVTMBT) and
non-CVTMBT patients from our hospital. Each column represents one specimen and each row represents one gene.
A previous study has demonstrated that elevated symptomatic was <1 week. A relatively rapid progression
venous pressure and abnormal venous reflux as a result of symptoms usually points to vascular disease, rather
of venous thromboembolism could lead to brain edema than invasive glioma. Our patients initially presented with
and intracranial hypertension, which may present as T2 generalized seizures, whereas the previous studies have
hyperintensity on MRI. Eventually, brain tissues experience reported that the most common clinical manifestation is
anoxia when the blood-brain barrier is disrupted, which acute hemiparesis [7,11,13-15] . Therefore, we conclude that the
could present as tumor-like enhancement . Although various sizes, locations, and degrees of cerebral venous
[23]
CVT may not be clearly observed on MRI, an indication to occlusion are the causes of the varying initial symptoms. Our
its location would still be helpful in explaining symptoms patients who presented with seizures received antiepileptics
or preparing for biopsy. Moreover, a significant decrease in to prevent seizure recurrence. In addition to seizures,
NAA levels may be observed in acute cerebral infarction by headache and vomiting caused by hypertension were also
MRS [24,25] , unlike in glioma. the common symptoms; a prompt depression could block
[23]
Similar with the previous studies [7,11,13-15] , the common the progression of cerebral infarction . Benefited from
thrombophilia-related risk factors of the five patients the sensitivity to molecular diffusion of water, diffusion-
from our hospital included a medication history of oral weighted MRI (DW-MRI) can distinguish either the type of
NSAIDs or analgesics (two patients), Marvelon use for edema or the change of injury accompanied by the history
hypermenorrhea (one patient), long-term anemia (one of seizure . Therefore, DWI can be an alternative modality
[3]
patient), and a medical history of cesarean section (one to explore the pathophysiology of CVT and prospectively
patient). The average duration that our patients were predict its prognosis in the future.
Volume 1 Issue 1 (2023) 6 https://doi.org/10.36922/bh.v1i1.188