
Page 46 - BH-1-2
P. 46
Brain & Heart RDN guided by novel blood pressure responses
A
B
C
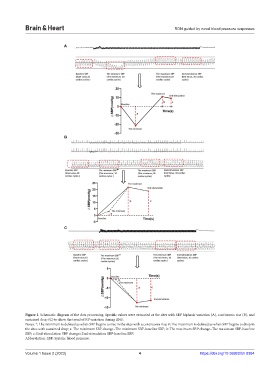
Figure 1. Schematic diagram of the data processing. Specific values were extracted at the sites with SBP biphasic variation (A), continuous rise (B), and
sustained drop (C) to show the trend of BP variation during RNS.
Notes: *: The minimum is defined as when SBP begins to rise in the sites with a continuous rise; #: The maximum is defined as when SBP begins to drop in
the sites with sustained drop; a: The minimum SBP change=The minimum SBP-baseline SBP; b: The maximum SBP change=The maximum SBP-baseline
SBP; c: End-stimulation SBP change=End-stimulation SBP-baseline SBP.
Abbreviation: SBP: Systolic blood pressure.
Volume 1 Issue 2 (2023) 4 https://doi.org/10.36922/bh.0384