
Page 48 - BH-1-2
P. 48
Brain & Heart RDN guided by novel blood pressure responses
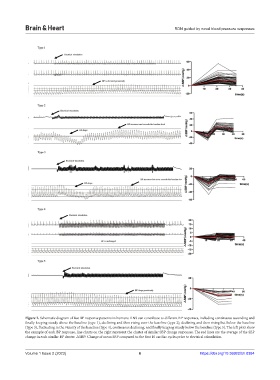
Figure 2. Schematic diagram of five BP response patterns in humans. RNS can contribute to different BP responses, including continuous ascending and
finally keeping steady above the baseline (type 1), declining and then rising over the baseline (type 2), declining and then rising but below the baseline
(type 3), fluctuating in the vicinity of the baseline (type 4), continuous declining, and finally keeping steady below the baseline (type 5). The left plots show
the example of each BP response, line charts on the right represent the cluster of similar SBP change responses. The red lines are the average of the SBP
change in each similar BP cluster. △SBP: Change of mean SBP compared to the first 10 cardiac cycles prior to electrical stimulation.
Volume 1 Issue 2 (2023) 6 https://doi.org/10.36922/bh.0384