
Page 58 - BH-2-1
P. 58
Brain & Heart Impact of ketogenic diet in adults with drug-resistant epilepsy
EEG was recorded according to the international 10 Where a negative value indicates a reduction in the
– 20 system at a sampling rate of 1024 Hz (580-G2CGSS, IED index. Statistical significance was set at P < 0.05; all
Biologic Co., USA). Epileptiform abnormalities were statistical analyses were conducted using SPSS 25.0 (IBM
assessed using both longitudinal bipolar montage and Co., USA).
average montage. A 2-h or long EEG session, covering
wakefulness and light sleep periods, was performed for all 3. Results
patients. We measured the discharge pattern, distribution 3.1. Clinical characteristics and demographic
of discharge, presence of background rhythm slowing, focal information
slow wave, presence of prolonged discharges, generalized
polyspike train (GPT), and generalized paroxysmal fast Out of the 52 initially recruited patients, only 16 patients
were eventually enrolled in our study, with 12 of them being
activity (GPFA). According to Sun et al., GPT was defined
as a high-amplitude burst of at least five generalized male. The average age at follow-up was 20.00 ± 4.03 years,
rhythmic discharges with frontal predominance, lasting and the mean age of onset was 8.06 ± 5.21 years. However,
less than 1 s. GPFA was defined as a generalized activity only eight of them successfully completed the 3-month diet
16
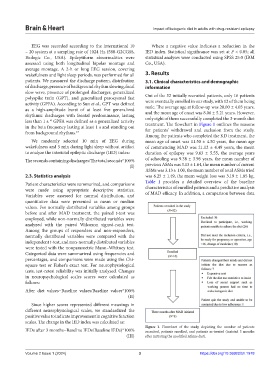
treatment. The flowchart in Figure 1 outlines the reasons
in the beta frequency lasting at least 1 s and standing out
from background rhythms. 17 for patients’ withdrawal and exclusion from the study.
Among the patients who completed the KD treatment, the
We randomly selected 10 min of EEG during mean age of onset was 11.50 ± 4.50 years, the mean age
wakefulness and 5 min during light sleep without artifact of commencing MAD was 21.12 ± 4.49 years, the mean
to analyze the interictal epileptic discharge (IED) index: duration of epilepsy was 9.63 ± 5.55, the average years
The seconds containing discharges/The total seconds*100% of schooling was 9.38 ± 3.96 years, the mean number of
(I) previous ASMs was 3.13 ± 1.64, the mean number of current
ASMs was 3.13 ± 1.00, the mean number of total ASMs tried
2.3. Statistics analysis was 6.25 ± 1.49, the mean weight loss was 3.19 ± 1.85 kg.
Table 1 provides a detailed overview of the baseline
Patient characteristics were summarized, and comparisons
were made using appropriate descriptive statistics. characteristics of enrolled patients and a predictive analysis
Variables were assessed for normal distribution, and of MAD efficacy. In addition, a comparison between data
quantitative data were presented as mean or median
values. For normally distributed variables among groups
before and after MAD treatment, the paired t-test was
employed, while non-normally distributed variables were
analyzed with the paired Wilcoxon signed-rank test.
Among the groups of responders and non-responders,
normally distributed variables were compared with the
independent t-test, and non-normally distributed variables
were tested with the nonparametric Mann–Whitney test.
Categorical data were summarized using frequencies and
percentages, and comparisons were made using the Chi-
square test or Fisher’s exact test. For neurophysiological
tests, test-retest reliability was initially analyzed. Changes
in neuropsychological scales scores were calculated as
follows:
After diet values−Baseline values/Baseline values*100%
(II)
Since higher scores represented different meanings in
different neurophysiological scales, we standardized the
positive value to indicate improvement in cognitive function
scales. The change in the IED index was calculated as:
Figure 1. Flowchart of the study, depicting the number of patients
IEDs after 3 months−Baseline IEDs/Baseline IEDs)*100% recruited, patients enrolled, and patients as-treated (insisted 3 months
(III) after initiating the modified Atkins diet).
Volume 2 Issue 1 (2024) 3 https://doi.org/10.36922/bh.1978