
Page 60 - BH-2-1
P. 60
Brain & Heart Impact of ketogenic diet in adults with drug-resistant epilepsy
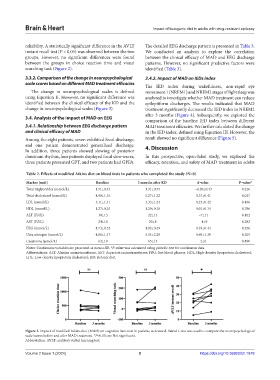
reliability. A statistically significant difference in the AVLT The detailed EEG discharge pattern is presented in Table 3.
instant recall test (P < 0.05) was observed between the two We conducted an analysis to explore the correlation
groups. However, no significant differences were found between the clinical efficacy of MAD and EEG discharge
between the groups in choice reaction time and visual patterns. However, no significant predictive factors were
searching task (Figure 2). identified (Table 3).
3.3.2. Comparison of the change in neuropsychological 3.4.2. Impact of MAD on IEDs index
scale scores based on different MAD treatment efficacies
The IED index during wakefulness, non-rapid eye
The change in neuropsychological scales is defined movement 1 (NREM1) and NREM2 stages of light sleep was
using Equation II. However, no significant difference was analyzed to investigate whether MAD treatment can reduce
identified between the clinical efficacy of the KD and the epileptiform discharges. The results indicated that MAD
change in neuropsychological scales (Figure 3). treatment significantly decreased the IED index in NREM2
after 3 months (Figure 4). Subsequently, we explored the
3.4. Analysis of the impact of MAD on EEG
comparison of the baseline IED index between different
3.4.1. Relationship between EEG discharge pattern MAD treatment efficacies. We further calculated the change
and clinical efficacy of MAD in the IED index, defined using Equation III. However, the
Among the eight patients, seven exhibited focal discharge, result showed no significant difference (Figure 5).
and one patient demonstrated generalized discharge. 4. Discussion
In addition, three patients showed slowing of posterior
dominant rhythm, four patients displayed focal slow waves, In this prospective, open-label study, we explored the
three patients presented GPT, and two patients had GPFA. efficacy, retention, and safety of MAD treatment in adults
Table 2. Effects of modified Atkins diet on blood tests in patients who completed the study (N=8)
Marker (unit) Baseline 3 months after KD d‑value P‑value*
Total triglycerides (mmol/L) 1.51±0.43 1.31±0.75 −0.20±0.43 0.226
Total cholesterol (mmol/L) 4.90±1.16 5.27±1.22 0.37±0.41 0.037
LDL (mmol/L) 3.11±1.11 3.33±1.24 0.23±0.42 0.166
HDL (mmol/L) 1.27±0.25 1.29±0.18 0.01±0.14 0.786
ALT (IU/L) 30±13 22±13 −7±11 0.102
AST (IU/L) 24±10 20±8 −4±9 0.282
FBG (mmol/L) 4.73±0.32 4.92±0.49 0.19±0.44 0.256
Urea nitrogen (mmol/L) 4.86±1.17 5.54±2.20 0.69±1.39 0.205
Creatinine (µmol/L) 63±10 65±13 2±6 0.490
Notes: Continuous variables are presented as mean±SD. *P-value was calculated using paired t-test for continuous data.
Abbreviations: ALT: Alanine aminotransferase; AST: Aspartate aminotransferase; FBG: Fast blood glucose; HDL: High-density lipoprotein cholesterol;
LDL: Low-density lipoprotein cholesterol; KD: Ketonic diet.
Figure 2. Impact of modified Atkins diet (MAD) on cognitive function in patients as-treated. Paired t-test was used to compare the neuropsychological
scale scores before and after MAD treatment. *P<0.05; ns: Not significant.
Abbreviation: AVLT: auditory verbal learning test.
Volume 2 Issue 1 (2024) 5 https://doi.org/10.36922/bh.1978