
Page 59 - BH-2-1
P. 59
Brain & Heart Impact of ketogenic diet in adults with drug-resistant epilepsy
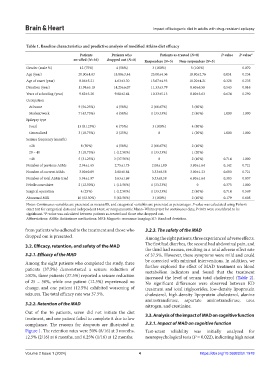
Table 1. Baseline characteristics and predictive analysis of modified Atkins diet efficacy
Patients Patients who Patients as‑treated (N=8) P‑value P‑value*
enrolled (N=16) dropped out (N=8) Responders (N=3) Non‑responders (N=5)
Gender (male %) 12 (75%) 4 (50%) 3 (100%) 5 (100%) 0.070
Age (year) 20.00±4.03 18.88±3.44 25.00±4.36 18.80±2.76 0.051 0.234
Age of onset (year) 8.06±5.21 4.63±3.30 13.67±4.93 10.20±4.21 0.328 0.235
Duration (year) 11.94±6.10 14.25±6.07 11.33±3.79 8.60±6.58 0.543 0.816
Years of schooling (year) 9.62±3.26 9.88±2.64 10.33±5.13 8.80±3.63 0.634 0.290
Occupation
At home 9 (56.25%) 4 (50%) 2 (66.67%) 3 (60%)
Student/work 7 (43.75%) 4 (50%) 1 (33.33%) 2 (40%) 1.000 1.000
Epilepsy type
Focal 13 (81.25%) 6 (75%) 3 (100%) 4 (80%)
Generalized 3 (18.75%) 2 (25%) 0 1 (20%) 1.000 1.000
Seizure frequency (month)
<20 8 (50%) 4 (50%) 2 (66.67%) 2 (40%)
20 – 40 3 (18.75%) 1 (12.50%) 1 (33.33%) 1 (20%)
>40 5 (31.25%) 3 (37.50%) 0 2 (40%) 0.714 1.000
Number of previous ASMs 2.94±1.65 2.75±1.75 2.00±1.00 3.80±1.64 0.142 0.721
Number of current ASMs 3.00±0.89 2.88±0.84 3.33±0.58 3.00±1.23 0.680 0.721
Number of total ASMs tried 5.94±1.97 5.63±1.69 5.33±0.58 6.80±1.64 0.383 0.857
Febrile convulsive 2 (12.50%) 1 (12.50%) 1 (33.33%) 0 0.375 1.000
Surgical operation 4 (25%) 1 (12.50%) 1 (33.33%) 2 (40%) 0.714 0.569
Abnormal MRI 10 (62.50%) 5 (62.50%) 3 (100%) 2 (40%) 0.179 0.608
Notes: Continuous variables are presented as mean±SD, and categorical variables are presented as percentages. P value was calculated using Fisher’s
exact test for categorical data and independent t-test, or nonparametric Mann–Whitney test for continuous data; P<0.05 were considered to be
significant. *P-value was calculated between patients as-treated and those who dropped out.
Abbreviations: ASMs: Antiseizure medications; MRI: Magnetic resonance imaging; SD: Standard deviation.
from patients who adhered to the treatment and those who 3.2.3. The safety of the MAD
dropped out is presented. Among the eight patients, three experienced adverse effects.
3.2. Efficacy, retention, and safety of the MAD The first had diarrhea, the second had abdominal pain, and
the third had nausea, resulting in a total adverse effect rate
3.2.1. Efficacy of the MAD of 37.5%. However, these symptoms were mild and could
be corrected with minimal interventions. In addition, we
Among the eight patients who completed the study, three further explored the effect of MAD treatment on blood
patients (37.5%) demonstrated a seizure reduction of metabolism indicators and found that the treatment
≥50%, three patients (37.5%) reported a seizure reduction increased the level of serum total cholesterol (Table 2).
of 25 – 50%, while one patient (12.5%) experienced no No significant differences were observed between KD
change, and one patient (12.5%) exhibited worsening of treatment and total triglycerides, low-density lipoprotein
seizures. The total efficacy rate was 37.5%. cholesterol, high-density lipoprotein cholesterol, alanine
aminotransferase, aspartate aminotransferase, urea
3.2.2. Retention of the MAD nitrogen, and creatinine.
Out of the 16 patients, seven did not initiate the diet 3.3. Analysis of the impact of MAD on cognitive function
treatment, and one patient failed to complete it due to low
compliance. The reasons for dropouts are illustrated in 3.3.1. Impact of MAD on cognitive function
Figure 1. The retention rates were 50% (8/16) at 3 months, Test-retest reliability was initially analyzed for
12.5% (2/16) at 6 months, and 6.25% (1/16) at 12 months. neuropsychological tests (P = 0.022), indicating high retest
Volume 2 Issue 1 (2024) 4 https://doi.org/10.36922/bh.1978