
Page 47 - DP-2-1
P. 47
Design+ Legitimizing design thinking in companies
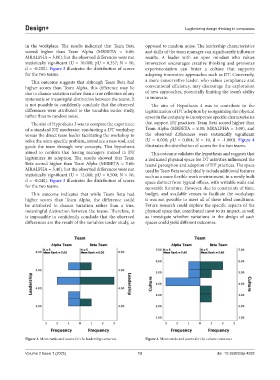
in the workplace. The results indicated that Team Beta opposed to random noise. The leadership characteristics
scored higher than Team Alpha (MRBETA = 6.00; and skills of the team manager can significantly influence
MRALPHA = 5.00), but the observed differences were not results. A leader with an open mindset who values
statistically significant (U = 10.000; pU = 0.357; N = 10, innovation encourages creative thinking and promotes
d = -0.200). Figure 2 illustrates the distribution of scores experimentation can foster a culture that supports
for the two teams. adopting innovative approaches such as DT. Conversely,
This outcome suggests that although Team Beta had a more conservative leader, who values compliance and
higher scores than Team Alpha, this difference may be conventional efficiency, may discourage the exploration
due to chance variation rather than a true reflection of any of new approaches, potentially limiting the team’s ability
systematic or meaningful distinction between the teams. It to innovate.
is not possible to confidently conclude that the observed The aim of Hypothesis 4 was to contribute to the
differences were attributed to the variables under study, legitimization of DT adoption by reorganizing the physical
rather than to random noise. space in the company to incorporate specific characteristics
The aim of Hypothesis 3 was to compare the experience that support DT practices. Team Beta scored higher than
of a standard DT moderator conducting a DT workshop Team Alpha (MRBETA = 8.00; MRALPHA = 3.00), and
versus the direct team leader facilitating the workshop to the observed differences were statistically significant
solve the team-specific problem, introduce a new tool, and (U = 0.000; pU = 0.004; N = 10, d = -1.000). Figure 4
guide the team through new concepts. This hypothesis illustrates the distribution of scores for the two teams.
aimed to confirm that having managers trained in DT This outcome validates the hypothesis and suggests that
legitimizes its adoption. The results showed that Team a dedicated physical space for DT activities influenced the
Beta scored higher than Team Alpha (MRBETA = 5.60; teams’ perception and adoption of DT practices. The space
MRALPHA = 5.40), but the observed differences were not used by Team Beta would ideally include additional features
statistically significant (U = 12.000; pU = 0.500; N = 10, such as a more flexible work environment, in a newly built
d = -0.040). Figure 3 illustrates the distribution of scores space distinct from typical offices, with writable walls and
for the two teams. moveable furniture. However, due to constraints of time,
This outcome indicates that while Team Beta had budget, and available venues to facilitate the workshop,
higher scores than Team Alpha, the difference could it was not possible to meet all of these ideal conditions.
be attributed to chance variation rather than a true, Future research could explore the specific aspects of the
meaningful distinction between the teams. Therefore, it physical space that contributed most to its impact, as well
is impossible to confidently conclude that the observed as investigate whether variations in the design of such
differences are the result of the variables under study, as spaces could yield different outcomes.
Figure 2. Mean ranks and scores for the leadership construct Figure 3. Mean ranks and scores for the culture construct
Volume 2 Issue 1 (2025) 13 doi: 10.36922/dp.4292