
Page 46 - DP-2-1
P. 46
Design+ Legitimizing design thinking in companies
Wilcoxon–Mann–Whitney non-parametric test for two the day after the theoretical training, which may have
independent samples. Statistical analyses were performed provided greater continuity and a stronger connection
48
using IBM SPSS Statistics software, version 28, with between the concepts learned and their practical
α = 0.05. As this software version of the software does not application. This workshop timing allowed Team Alpha
calculate the effect size for the Wilcoxon–Mann–Whitney to maintain momentum and enthusiasm during the
test, we manually computed the effect size using the theoretical training, potentially enhancing their ability
formula presented by Marôco. 49 to adopt and implement DT more effectively. On the
other hand, Team Beta had a 2-week gap between the
4. Results theoretical training and the practical workshop, which
Table 3 presents the results of the Wilcoxon–Mann– may have led to a disconnect between theory and
Whitney non-parametric test for all research hypotheses. practice. This gap in time could have resulted in a loss
According to the results, only the dimension of physical of enthusiasm, interest, and even some forgetting of key
space showed statistically significant differences between concepts.
the two teams. Although Team Beta’s scores were higher The aim of Hypothesis 2 was to empower employees to
than Team Alpha on all other dimensions, these differences speak up and build trust, thereby increasing their focus on
were not statistically significant. work. This increase in productivity occurs when employees
Hypothesis 1 aimed to promote closer relationships, feel heard while expressing their opinions, which leads to a
relaxation, increased bonding among team members, decrease in negative attitudes and an increase in happiness
more idea sharing in a more informal environment,
stimulate adaptability in activities outside one’s comfort
zone, and foster greater motivation and productivity
among employees. The results showed that Team Beta
scored higher than Team Alpha (MRBETA = 5.70;
MRALPHA = 5.30), but the observed differences are not
statistically significant (U = 13.500; pU = 0.429; N = 10,
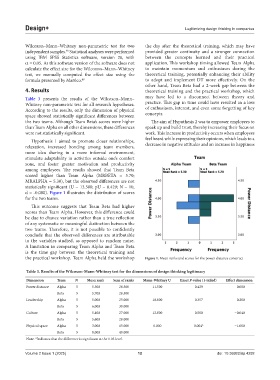
d = -0.080). Figure 1 illustrates the distribution of scores
for the two teams.
This outcome suggests that Team Beta had higher
scores than Team Alpha. However, this difference could
be due to chance variation rather than a true reflection
of any systematic or meaningful distinction between the
two teams. Therefore, it is not possible to confidently
conclude that the observed differences are attributable
to the variables studied, as opposed to random noise.
A limitation in comparing Team Alpha and Team Beta
is the time gap between the theoretical training and
the practical workshop. Team Alpha held the workshop Figure 1. Mean ranks and scores for the power distance construct
Table 3. Results of the Wilcoxon‑Mann‑Whitney test for the dimensions of design thinking legitimacy
Dimension Team N Mean rank Sum of ranks Mann‑Whitney U Exact P-value (1‑tailed) Effect dimension
Power distance Alpha 5 5.300 26.500 11.500 0.429 −0.080
Beta 5 5.700 28.500
Leadership Alpha 5 5.000 25.000 10.000 0.357 −0.200
Beta 5 6.000 30.000
Culture Alpha 5 5.400 27.000 12.000 0.500 −0.040
Beta 5 5.600 28.000
Physical space Alpha 5 3.000 15.000 0.000 0.004* −1.000
Beta 5 8.000 40.000
Note: *Indicates that the difference is significant at the 0.05 level.
Volume 2 Issue 1 (2025) 12 doi: 10.36922/dp.4292