
Page 76 - DP-2-1
P. 76
Design+ Evaluating a building code app
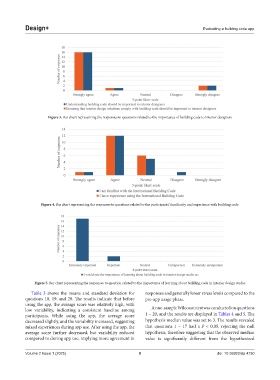
Figure 3. Bar chart representing the responses to questions related to the importance of building code to interior designers
Figure 4. Bar chart representing the responses to questions related to the participants’ familiarity and experience with building code
Figure 5. Bar chart representing the responses to question related to the importance of learning about building code in interior design studio
Table 3 shows the means and standard deviation for responses and generally lower stress levels compared to the
questions 18, 19, and 20. The results indicate that before pre-app usage phase.
using the app, the average score was relatively high, with
low variability, indicating a consistent baseline among A one-sample Wilcoxon test was conducted on questions
participants. While using the app, the average score 1 – 20, and the results are displayed in Tables 4 and 5. The
decreased slightly, and the variability increased, suggesting hypothesis median value was set to 3. The results revealed
mixed experiences during app use. After using the app, the that questions 1 – 17 had a P < 0.05, rejecting the null
average score further decreased, but variability reduced hypothesis, therefore suggesting that the observed median
compared to during app use, implying more agreement in value is significantly different from the hypothesized
Volume 2 Issue 1 (2025) 8 doi: 10.36922/dp.4730