
Page 77 - DP-2-1
P. 77
Design+ Evaluating a building code app
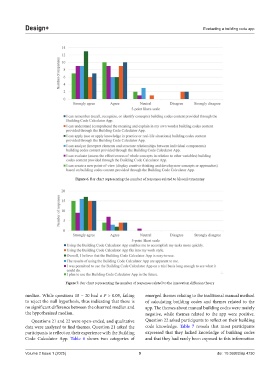
Figure 6. Bar chart representing the number of responses related to bloom’s taxonomy
Figure 7. Bar chart representing the number of responses related to the innovation diffusion theory
median. While questions 18 – 20 had a P > 0.05, failing emerged themes relating to the traditional manual method
to reject the null hypothesis, thus indicating that there is of calculating building codes and themes related to the
no significant difference between the observed median and app. The themes about manual building codes were mainly
the hypothesized median. negative, while themes related to the app were positive.
Questions 21 and 22 were open-ended, and qualitative Question 22 asked participants to reflect on their building
data were analyzed to find themes. Question 21 asked the code knowledge. Table 7 reveals that most participants
participants to reflect on their experience with the Building expressed that they lacked knowledge of building codes
Code Calculator App. Table 6 shows two categories of and that they had rarely been exposed to this information
Volume 2 Issue 1 (2025) 9 doi: 10.36922/dp.4730