Page 45 - EER-2-3
P. 45

Explora: Environment
            and Resource                                                        Maize–pigeon pea intercropping in Ghana


            A                                                  determine plot yield (kg). A total of 20 cobs from each plot
                                                               were shelled to measure fresh grain weight, and shelling
                                                               recovery was calculated as the ratio of fresh grain weight to
                                                               the total weight of the 20 cobs. Similarly, pigeon pea grain
                                                               yield was determined at physiological maturity by shelling
                                                               all pods from the harvest and recording the fresh grain
                                                               weight (kg). Grain moisture content for both maize and
                                                               pigeon peas was measured using a universal grain moisture
                                                               meter (INDOSAN S6010, Indosaw, India), and grain yields
                                                               were adjusted to a standardized moisture content of 15%,
                                                               with final yields expressed in tons/ha, as indicated in the
                                                               equations.

                                                               Adjusted mositure   100  Actual moisture content−
                                                               content (MC )    = 100  Desired moisture content
                                                                                     −
                                                                         adj
            B
                                                                                                           (1)
                                                                                     Plot yield (kg)  1  0,000 m×  − 2
                                                               Grain yield             MC    SR% ×  adj  ×
                                                               ( tons/ha at1  5% MC adj )  =  12 m   1  ,000×
                                                                                              −
                                                                                               2
                                                                                                           (II)
                                                                 To compare the productivity of monoculture and
                                                               MPP intercropping, the LER was employed, calculated as
                                                               follows:

                                                                     YI    YI
                                                               LER    m    P                            (III)
                                                                     YS    YS
                                                                      m
                                                                            P
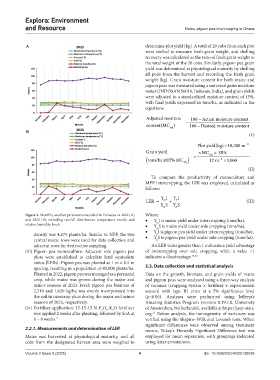
            Figure 2. Monthly weather parameters recorded in Fumesua in 2022 (A)   Where:
            and 2023 (B), including rainfall distribution, temperature trends, and   •   Y I is maize yield under intercropping (tons/ha),
                                                                    m
            relative humidity levels                           •   Y S is maize yield under sole cropping (tons/ha),
                                                                    m
                                                               •   Y I is pigeon pea yield under intercropping (tons/ha),
               density was 4,875 plants/ha. Similar to NPP, the two   p
               central maize rows were used for data collection and   •   Y S is pigeon pea yield under sole cropping (tons/ha).
                                                                    p
               adjacent rows for destructive sampling.           An LER value greater than 1 indicates a yield advantage
            (iii) Pigeon  pea  monoculture:  Adjacent  sole pigeon pea   of intercropping over sole cropping, while a value <1
               plots were established to calculate land equivalent   indicates a disadvantage. 19,20
               ratios [LERs]. Pigeon pea was planted at 1 m × 0.5 m
               spacing, resulting in a population of 40,000 plants/ha.   2.3. Data collection and statistical analysis
               Planted in 2022, pigeon pea was managed as a perennial   Data on the growth, biomass, and grain yields of maize
               crop, while maize was grown during the major and   and pigeon peas were analyzed using a three-way analysis
               minor seasons of 2023. Fresh pigeon pea biomass of   of variance (cropping system × fertilizer × experimental
               2,210 and 1,620 kg/ha was evenly incorporated into   season) with type  III error at a 5% significance level
               the soil in intercrop plots during the major and minor   (p<0.05). Analyses were performed using Jeffreys’s
               seasons of 2023, respectively.                  Amazing Statistics Program  (version 0.19.1.0, University
            (iv)  Fertilizer application: 15-15-15 N-P O -K O fertilizer   of Amsterdam, Netherlands),  available at https://jasp-stats.
                                              5
                                                 2
                                            2
               was applied 2 weeks after planting, followed by SoA at   org.  Before analysis, the homogeneity of variances was
                                                                  21
               6 – 8 weeks. 4                                  verified using the Shapiro–Wilk and Levene’s tests. When
                                                               significant differences were observed among treatment
            2.2.1. Measurements and determination of LER       means, Tukey’s Honestly Significant Difference test was
            Maize  was  harvested  at  physiological  maturity,  and  all   employed for mean separation, with groupings indicated
            cobs from the designated harvest area were weighed to   using letter annotations.
            Volume 2 Issue 3 (2025)                         4                           doi: 10.36922/EER025130026
   40   41   42   43   44   45   46   47   48   49   50