
Page 120 - EJMO-9-2
P. 120
Eurasian Journal of
Medicine and Oncology Understanding ulcerative colitis
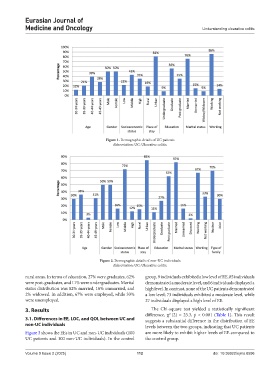
Figure 1. Demographic details of UC patients
Abbreviation: UC: Ulcerative colitis.
Figure 2. Demographic details of non-UC individuals
Abbreviation: UC: Ulcerative colitis.
rural areas. In terms of education, 27% were graduates, 62% group, 9 individuals exhibited a low level of EE, 85 individuals
were post-graduates, and 11% were undergraduates. Marital demonstrated a moderate level, and 6 individuals displayed a
status distribution was 82% married, 16% unmarried, and high level. In contrast, none of the UC patients demonstrated
2% widowed. In addition, 67% were employed, while 33% a low level; 73 individuals exhibited a moderate level, while
were unemployed. 27 individuals displayed a high level of EE.
3. Results The Chi-square test yielded a statistically significant
difference, χ (2) = 23.3, p < 0.001 (Table 1). This result
2
3.1. Differences in EE, LOC, and QOL between UC and suggests a substantial difference in the distribution of EE
non-UC individuals levels between the two groups, indicating that UC patients
Figure 3 shows the EEs in UC and non-UC individuals (100 are more likely to exhibit higher levels of EE compared to
UC patients and 100 non-UC individuals). In the control the control group.
Volume 9 Issue 2 (2025) 112 doi: 10.36922/ejmo.8596